Concept 4 – Statistics

[expand title=”Which tool is more precise?”]

Core Connections, Course 2, Lesson 8.1.1. Measurement Precision. Which tool is more precise?

8-1. WHICH TOOL GIVES A MORE PRECISE MEASUREMENT?

Have you heard the expression, “Measure twice, cut once”?  This advice refers to the care that professionals such as carpenters and fashion designers need to take to measure precisely so that all of the parts of their creations fit together correctly.  Careful, correct measurements also ensure that they do not waste materials.  Does it matter what tool they use to make their measurements?

Imagine using two different tools, such as a 12-inch ruler and a continuous measuring tape, to measure a length of your classroom or the width of a basketball court (in inches).  How might the measurements that you get compare?

Discuss the following questions with your team.  Be prepared to share your ideas with the rest of the class.

  • Would you get the same measurement with each tool?
  • Why might the measures be different?  Should they be the same?
  • Which tool do you think would give you a more precise measurement, that is, one that is closer to the true length of the classroom?


8-2. Now you and your class will gather data to test your ideas about the precision of measuring the same length with two different tools.

Your Task: As directed by your teacher, measure the specified length in the classroom to the nearest inch twice, each time using a different tool (a 12-inch ruler and a single measuring tape, for example).  Although you will share tools with your team and work together to make sure the measures are recorded properly, each person in the team should measure the length twice, once with each tool.


8-3. Once your team members have each made their measurements, compare the results within your team by answering the following questions:

  • Which tool seems to measure more precisely?
  • What do you think is the actual length of the classroom?  How did you decide?
  • Which tool do you think gave you a better answer?


8-4. Add your data to the class data table.

a. Examine the sets of data.  Record any initial observations you can make.

b. Are there any measures that look very different from the others?  These extreme values are called outliers, because they are far away from most of the data.  What could you do to help you see any outliers better?

c. Sometimes an outlier can reveal that an error or misunderstanding has occurred.  Decide as a class if any data needs to be deleted or corrected due to an error or misunderstanding.

d. What is the range for each set of data?  How do the ranges compare?  For each set of data, what is the median?  What is the first quartile?  The third quartile?


8-5. Creating visual representations of data makes data sets easier to compare.

a. Make a histogram for each set of data.  Make sure to use the same scale for both histograms. (How To)

b. Create box plots for the two sets of data.  Put both box plots on the same number line and use the same scale as you did for your histogram. (How To)

c. Compare the center, shape, spread, and outliers for the two sets of data using the histograms and the box plots.  Do the data sets seem to show the same value for the length of the classroom?


8-6. WHICH MEASUREMENT IS BEST?

So what is the actual measure?  Clearly you have multiple measurements from which to choose.  How can you decide what is the best estimate of the length of the classroom?

Look at the data set for each tool, along with their histograms and box plots, and consider the center, shape, spread, and outliers.  With your team, discuss what you can learn from each of these pieces of information about the precision (consistency) of each measuring tool, as well as about the length of the classroom.  Which of the many numbers that you could choose is the best estimate for the actual length of the classroom?  Why?  What do you think accounts for the greater consistency of one tool?


8-7. IS MEASUREMENT ALWAYS APPROXIMATE?

As you have seen, the measurements that you made are approximate.  Is this always true?  Can you imagine a way to measure something that would be exact without any variability?  Discuss this with your team and be prepared to share your ideas with the class.


Assignment: 8.1.1 Homework

[/expand]

[expand title=”How can I compare the results?”]

Core Connections, Course 2, Lesson 8.1.2. Comparing Distributions. How can I compare the results?

8-19. Josh is just starting a round of golf.  This first hole is 130 yards long.   He needs to decide which club to use for his first shot.  He has kept careful records about how close his first shots came to the hole, all from this same distance.  His records include data from his use of two different golf clubs, a wedge and an 8-iron, over the past  year.

Wedge, distance to hole (yards): 0    3    1    2   7   2   15  25   5   22
8-iron, distance to hole (yards): 19  12   12   8   3  11   5   7   10  13  8  10  11   20

a. Create a histogram and box plot for each of the clubs. Place the box plot above the histogram on the same number line for each club to make a combination plot.  Use a bin width of 5 yards.


b. To find the “typical” distance that Josh hits the ball from the hole with a wedge, is the mean or the median a better choice?  Find the typical distance Josh hits the ball from the hole with a wedge and compare it to the typical distance he hits the ball with an 8-iron.


c. Advise Josh which club to use.  Explain your thinking.


8-20. It is just as important to consider the spread of the data as it is to consider the center when comparing data sets.

a. Calculate the Interquartile Range (IQR) for each golf club in the previous problem.  With which club is Josh more consistent?


b. If Josh decided to use the 8-iron, he could “typically” expect to hit the ball so that it lands between 8 and 12 yards from the hole.  This is indicated by the box on the box plot display and corresponds with the IQR.  If Josh decided to use the wedge, what is a “typical” interval of distances from the hole he could expect the ball to land?


c. Compare the typical interval of distances for the 8-iron with the interval you found for the wedge.  Do you wish to modify your advice to Josh?  Explain.


8-21. Mr. Webb has only one more starting position available on his basketball team, but two students have tried out for it.  He wants to choose the student who is likely to score the most points.
The two students from whom he can choose are described below.

a. In her most recent games, Jana scored: 7  46  9  6  11  7  9  11  19  7  9  11  9  55  11 7 points, while Alejandra scored 13  15  9  18  13  17  17  15 points.  Which girl has the higher average (mean) number of points?

b. Which student do you think Mr. Webb should select and why?  Use parallel box plots (two box plots on the same number line) to support your explanation.

c. Why was the mean not a good measure of the girl’s typical performance?

d. Calculate the IQR to measure the variability of each girl’s performance.

e. Who had the higher median and by how many points?  How large is the difference between the medians measured by how many IQRs would fit
into it?


8-22. Gregory and his sister shared a tablet at home.  In order to be fair, they kept track of how much time they spent socializing with friends each day for the last two weeks.  Their usage in minutes follows:

Gregory: 49  48  51  52  68  40  73  68  61  60  69  55  51  59

His sister: 49  45  37  63  56  57  62  50  42  48  55  64  40  42

Make a parallel box plot to compare their usage.  Is their median usage notably different from each other?  If the usage is notably different, how much more did one of them use the tablet than the other, measured in number of IQRs?


Assignment: 8.1.2 Homework

[/expand]

[expand title=”Is the survey fair?”]

821 header


8-29.

As the social director of the Class Council, Ramin would like to survey a few students about their interests.

When Ramin analyzes the results from the survey, he wants to make claims about the interests of all of the students in his school.  If he were to survey only students on the Class Council, for example, it might be hard to make claims about what all students think.  Students who are on the Class Council may not have the same social interests as other students.  Consider this idea as you think about the samples described below.

  1. If Ramin wanted to generalize the opinions of all students at his school, would it make sense to go to the grocery store and survey the people there?  Why or why not?

  2. If he wanted to generalize the opinions of all students at his school, would it make sense to ask all of his friends at school?  Why or why not?

  3. If he wanted to generalize the opinions of all students at his school, would it make sense to ask every third person who entered the cafeteria at lunch?  Why or why not?

8-30.

There are a variety of ways to choose samples of the population you are studying.  Every sample has features that make it more or less representative of the larger population.  For example, if you want to represent all of the students at your school, but you survey all of the students at school 30 minutes after the last class has ended, you are likely to get a disproportionate number of students who play school sports, attend after-school activities, or go to after-school tutoring.

  1. If you ask the opinion of the people around you, then you have used a convenience sample.  If you took a convenience sample right now, what would be some features of the sample?  Would you expect a convenience sample to represent the entire student population at your school?  Why or why not?

  2. If you email or create an online questionnaire then you have used a voluntary response sample.  What are some features of the people in a volunteer response sample?  Could it represent the sample of all of the students at school accurately?

  3. You use a cluster sample if you first divide the students into smaller groups so that each of the smaller groups represents all of the students at your school.  Then you randomly select one or more of these groups to sample.  How might you divide the students at your school into groups that each represent the whole school?  Explain.  Are there any reasons that these clusters might not be fully representative of all the students at your school?

8-31.

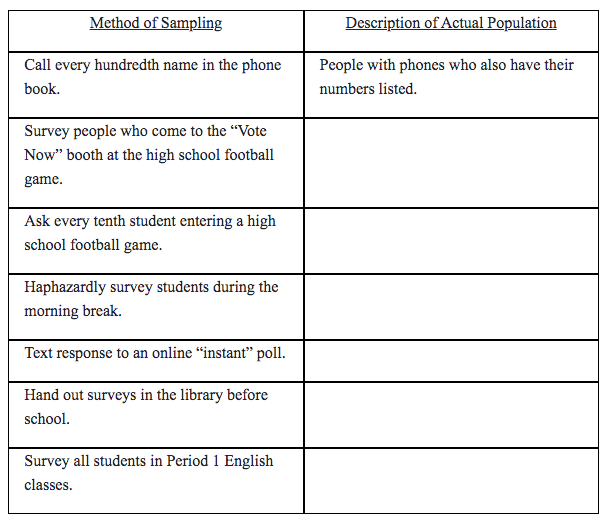
From what population is each of these samples taken?  Write down the actual population for each of these sampling techniques.

831 table

8-32.

A study at the University of Iowa in 2008 concluded that children that play violent video games are more aggressive in real life.  Children ages 9 to 12 were studied to determine how much they played violent video games; peers and teachers were asked how much these students hit, kicked, and got into fights with other students.

  1. Can you legitimately conclude from this study that teenagers who play violent video games tend to be more aggressive?  Why or why not?

  2. Can you legitimately conclude from this study that children ages 9 to 12 who play violent video games are more likely to commit violent crimes?  Why or why not?

  3. Can you legitimately conclude from this study that children ages 9 to 12 who play violent video games tend to hit and kick more in school?

  4. Can you legitimately conclude from this study that playing a lot of violent video games will cause 9 to 12-year-old students to become more violent at school?

8-33.

Addie was helping children in a kindergarten class learn to read.  She was curious how old the typical child was when they entered kindergarten.  It was not practical to look up the school records of all 100 kindergarteners.  So on the first day of school, Addie took a sample: she asked the parent of the first fifteen students to be dropped off at the school how old (in months) their child was.  Her data is listed below.

67  61  69  72  71  65  67  67  57  68  71  72  61  59  62

Make an inference (a statistical prediction) of the mean age of kindergarten children at the school.


Assignment:

[/expand]