[expand title=”Relating the Unit Rate and Constant of Proportionality”]
Essential Question:
7.RP.2d
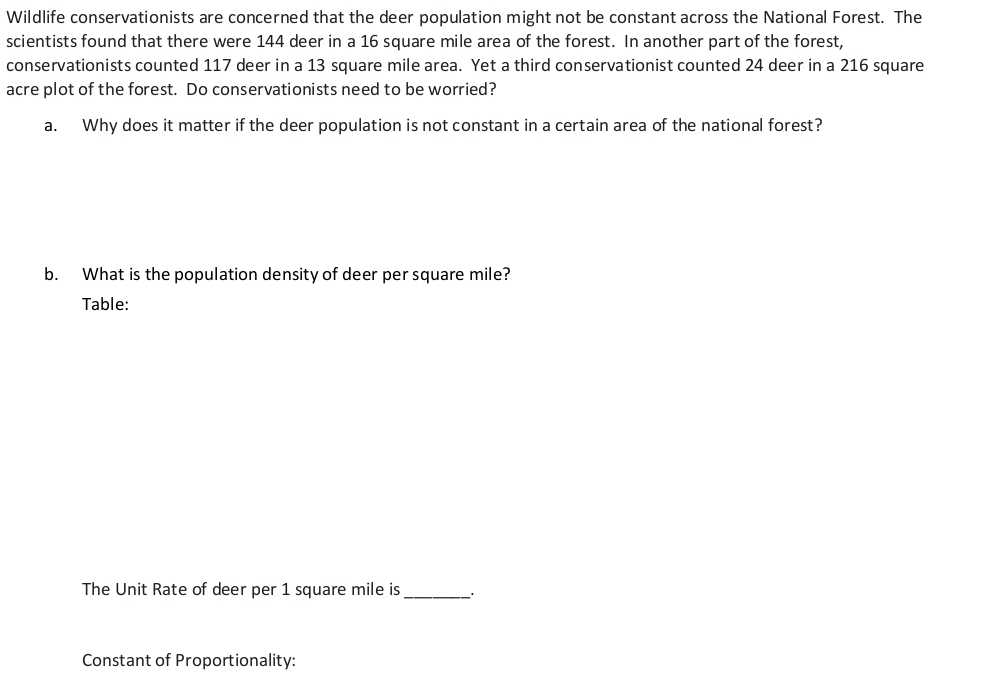
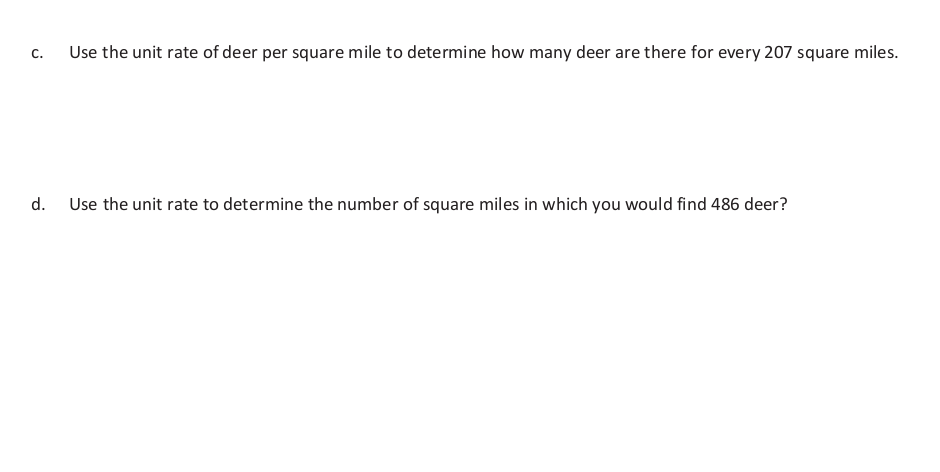
![]() Example 1
Example 1


![]()
Discussion
- How are the constant of proportionality and the unit rate alike?
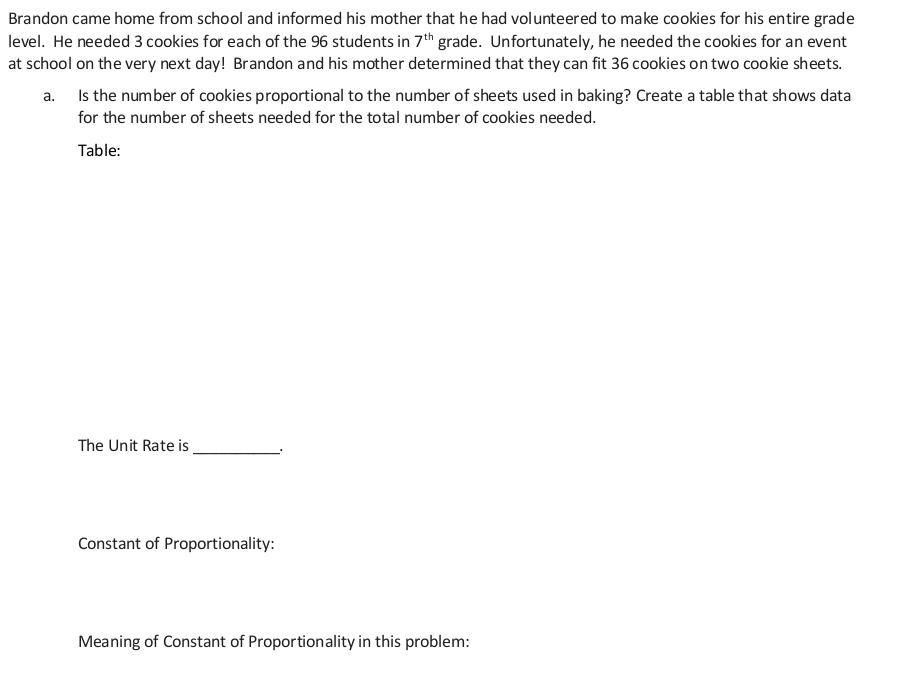
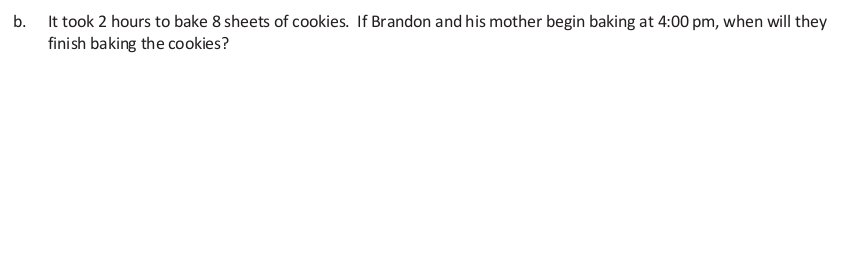
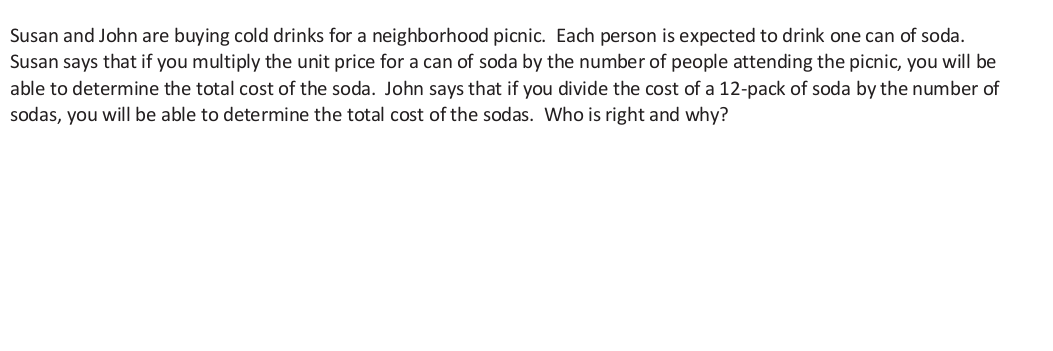
![]() Example 2
Example 2
![]()
Example 3
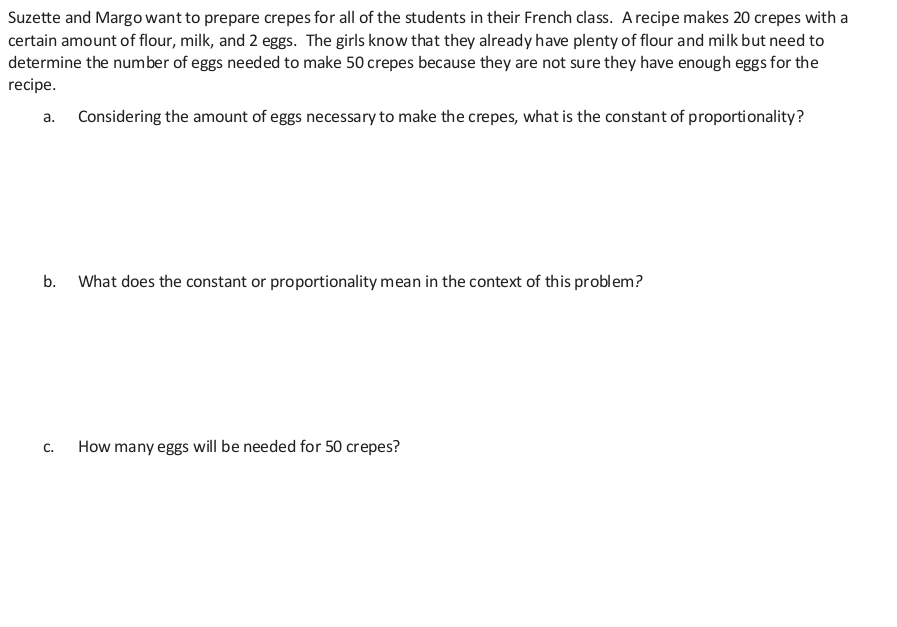
d. To the nearest egg, how many eggs would you need to make one crepe for every student at SRMS?
Lesson 7 Problem Set
Exit Ticket
Glencoe: 4-10 Ex 1 (1-4, 7-10)
[/expand]
[expand title=”Representing proportional relationships with an equation”]
Essential Question: Can you use the constant of proportionality in an equation to represent a real world example?
7.RP.2b
Warm up
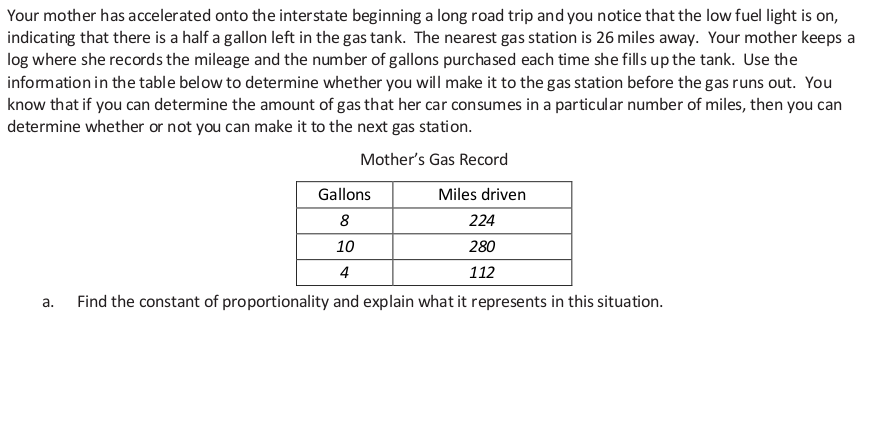
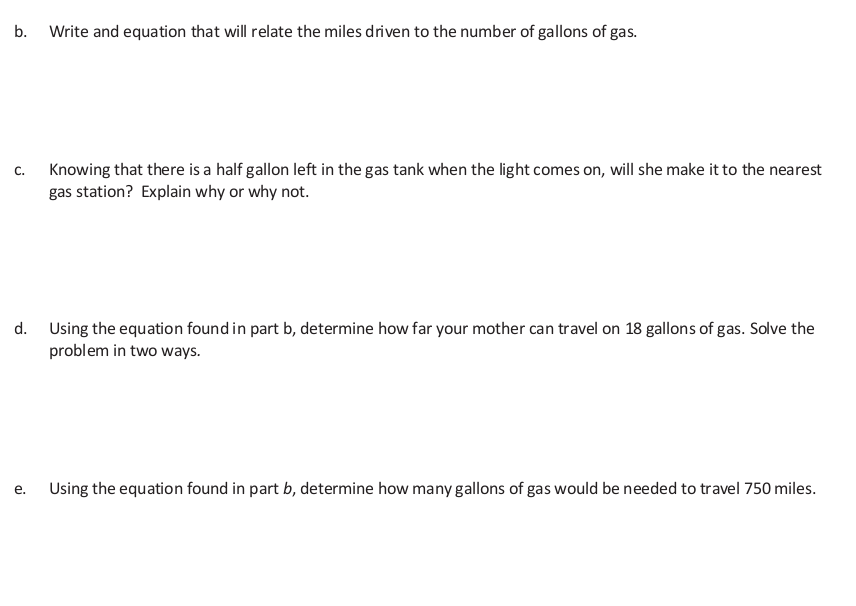
![]() Example 1: Do we have enough gas to make it to the gas station?
Example 1: Do we have enough gas to make it to the gas station?
![]()
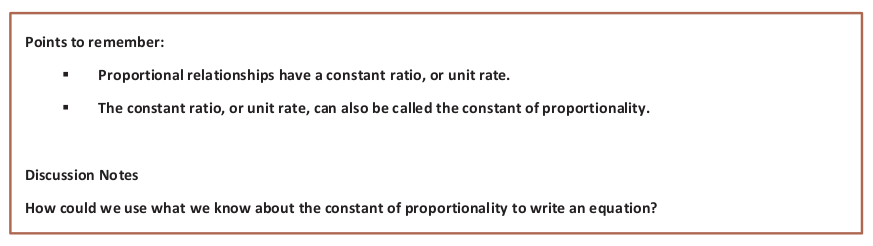
Discussion
![]() Example 1 Continued
Example 1 Continued
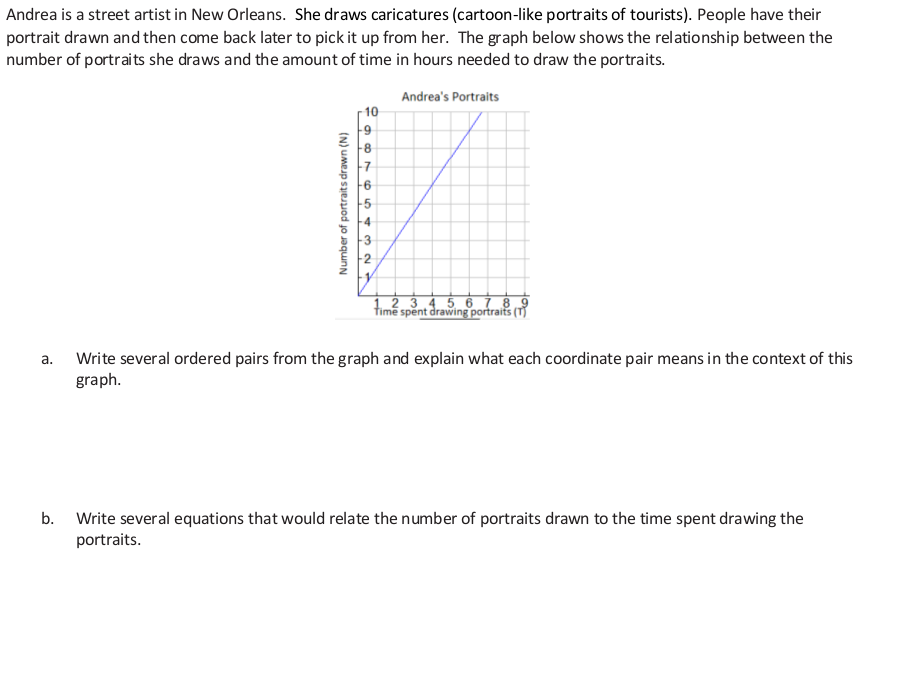
![]() Example 2: Andrea’s Portraits (Group Work)
Example 2: Andrea’s Portraits (Group Work)
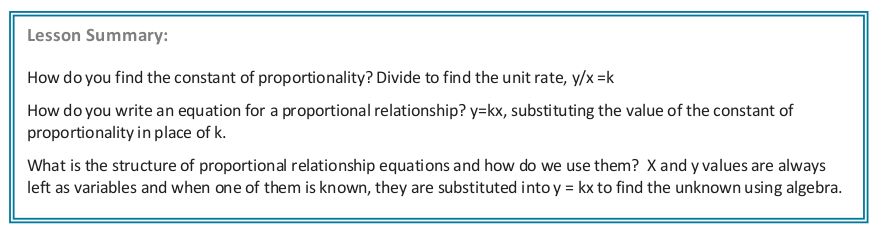
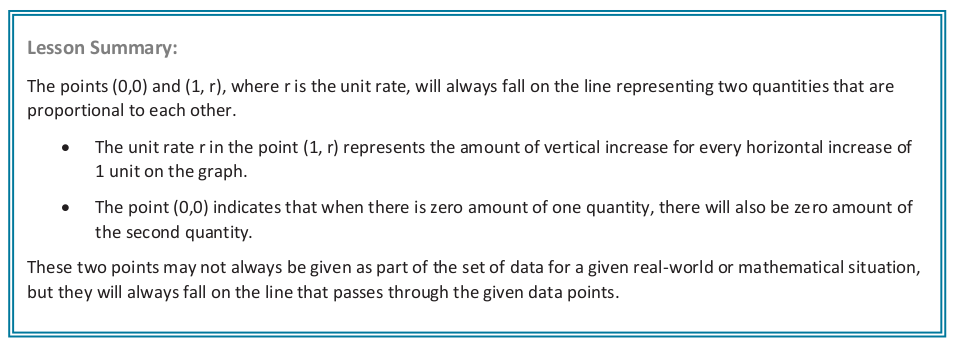
 Summary

Assingnment: Lesson 8 Problem Set
Exit
Lesson 9
Essential Question: Can you use the constant of proportionality in an equation to represent a real world example?
7.RP.2c
Warm up
![]() S.33
S.33
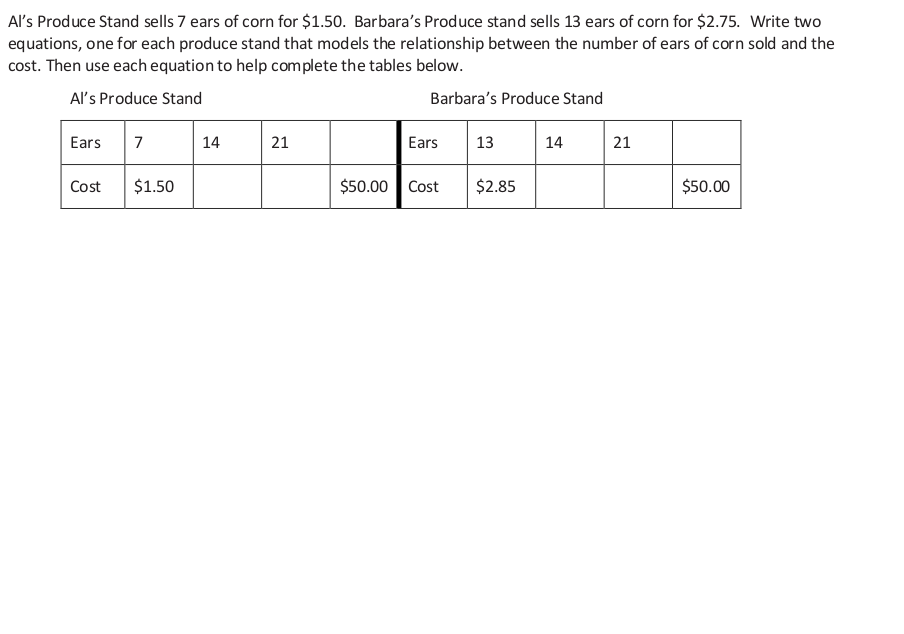
 Al’s Produce Stand
Discussion
- Which makes more sense: to use a unit rate of “ears of corn per dollar” or of “dollars/cents per ear of corn”?
- Based on the previous question, which would be the independent variable?
- Which would be the dependent variable and why?
- How do you write an equation for a proportional relationship in a generic form?
Summary
Assignment: Lesson 9 Problem Set
Exit
[/expand]
[expand title=”Understanding how to find k from y=kx“]
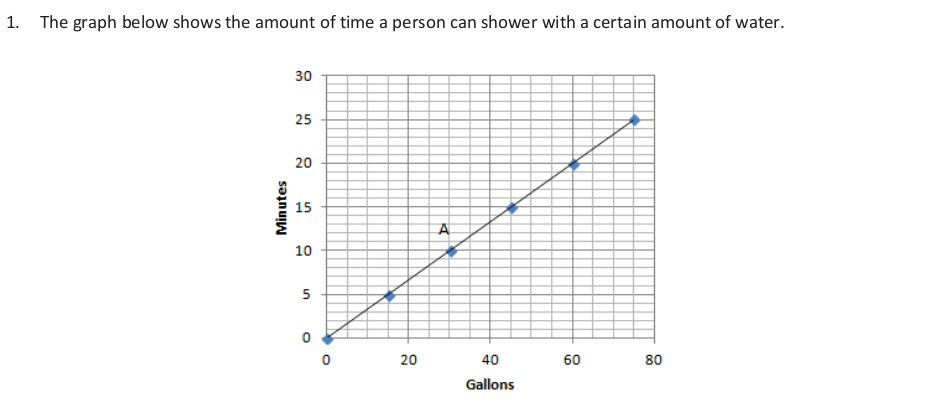
Essential Question: Can we identify the unit rate from a graph of a proportional relationship?
7.RP.2d
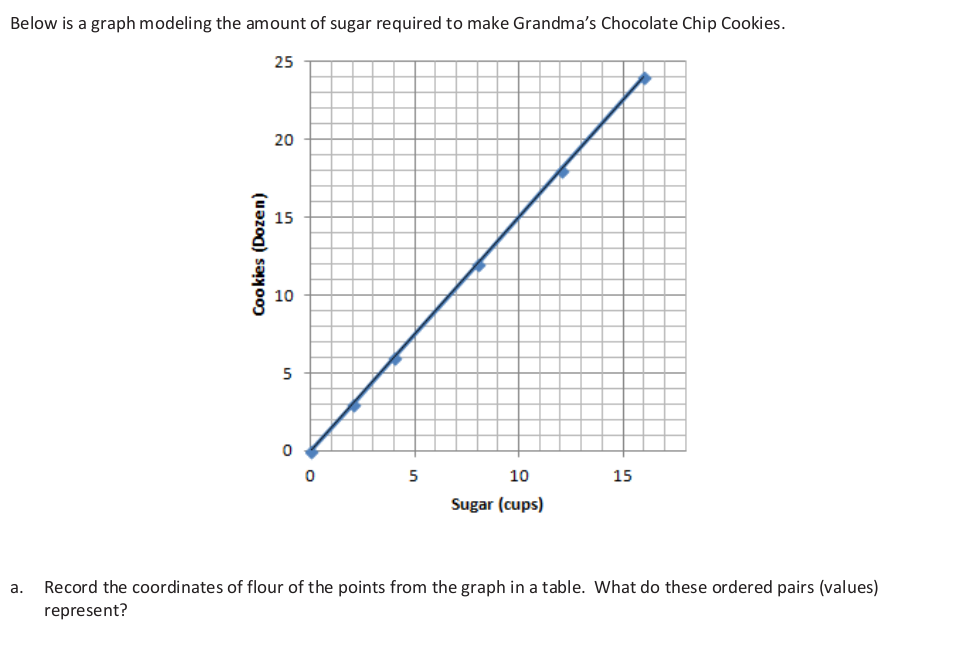
Grandma’s Special Chocolate Chip Cookie recipe, which yields 4 dozen cookies, calls for 3 cups of flour.
- Create a table based upon this relationship.
- Find the values for at least 3 additional quantities of cookies.
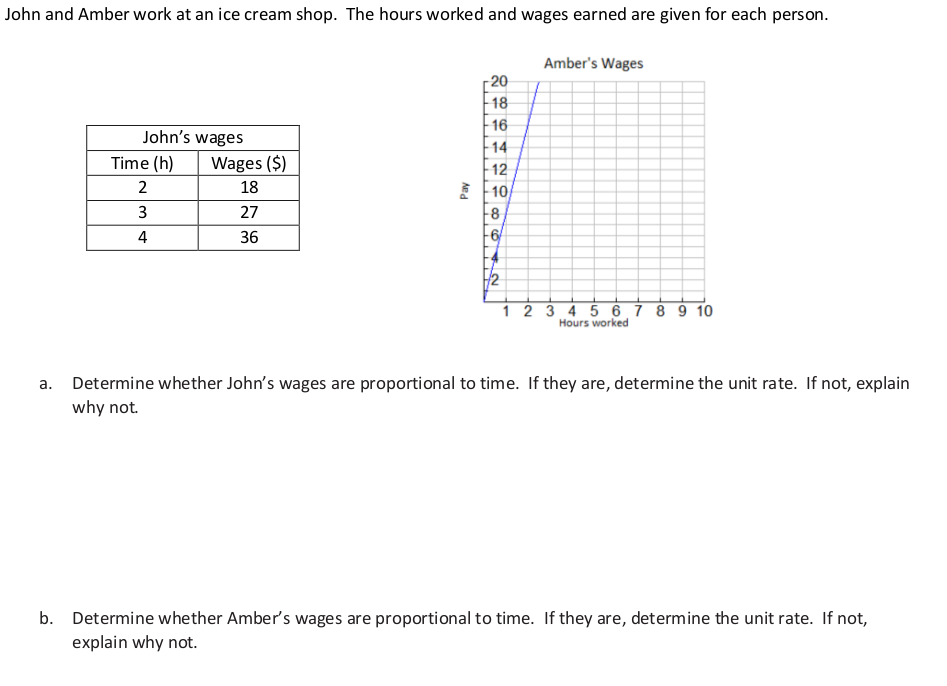
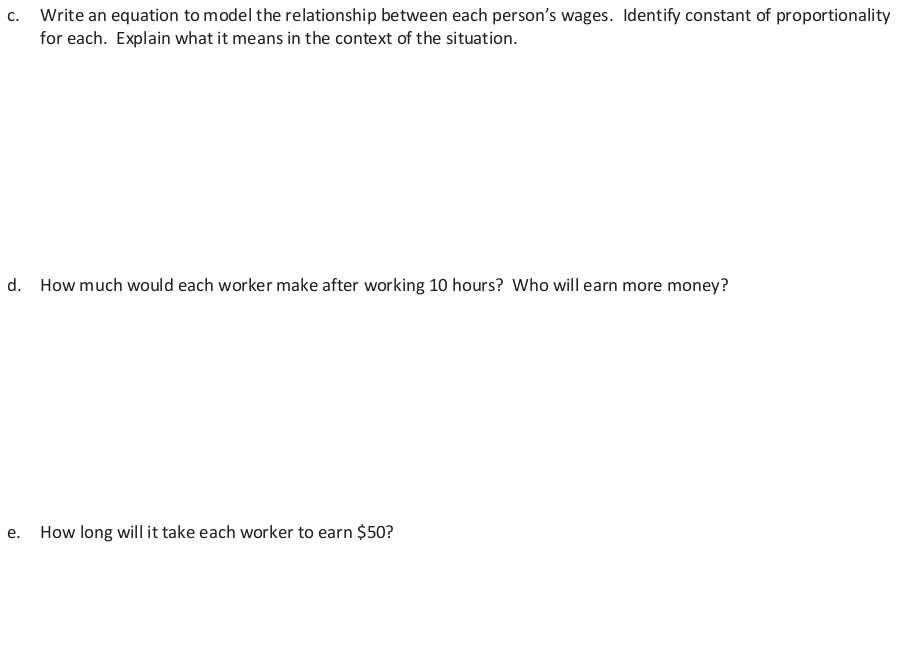
![]() Example 1
Example 1

![]()
Example 2 (Partner Work)
Discussion
- What quantity is measured along the horizontal axis?
- When you plot the ordered pair (A, B), what does A represent?
- What quantity is measured along the vertical axis?
- When you plot the point (A, B), what does B represent?
- What is the unit rate for this proportional relationship?
- How is the unit rate related to the graph?
![]() Exercise 1-2 (Partner Work)
Exercise 1-2 (Partner Work)
Assignment: Lesson 10 Problem Set
Exit
[/expand]