[expand title=”Introduction to Unit Rate”]
Essential Question: How is finding an associated rate or unit rate helpful when making comparisons between quantities?
7.RP.2
 S.1 Example 1: How fast is our class?
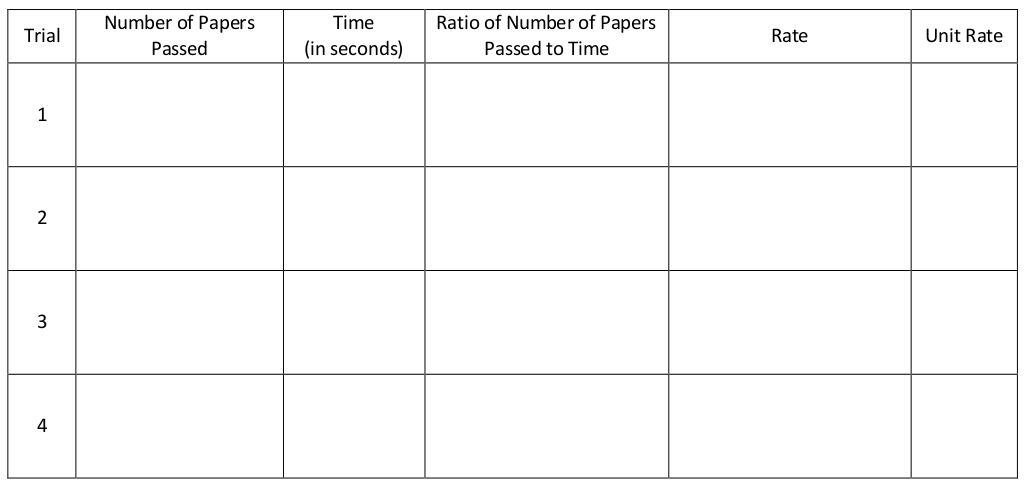
Discussion
- How will we measure our rate of passing out papers?
- What quantities will we use to describe our rate?
 S.2 Example 2: Which is a better buy?
Value-Mart is advertising a Back-To-School sale on pencils. A pack of 30 sells for $7.97 whereas a 12-pack of the same brand cost $4.77. Which is a better buy? How do you know?
Discussion
- How did you determine if the ratios are equivalent?
- Which is a better buy? Why?
Summary
How is finding an associated rate or unit rate helpful when making comparisons between quantities?
- The unit rate tells the quantity of one unit required for just one of another unit. For example, a unit price of 0.4 means 1 juice box from a 6-pack costs $0.4.
Unit Rate is a useful way of comparing ratios and rates containing different units. Unit rate allows us to examine units of one quantity per 1 unit of the second quantity. Unit rates allow us to convert from one unit to another, such as 12 inches per foot, or
A very common example of a unit rate is Miles Per Hour (MPH). As a ratio, this is the number of miles traveled in 1 hour. Notice how one of the units is 1, making this a unit rate.
Assignment: Lesson 1 Problem set (1-5)
Textbook: Glencoe: 4-1 Ex 1-3
[/expand]
[expand title=”What is proportionality?”]
![]() S.4 Example 1
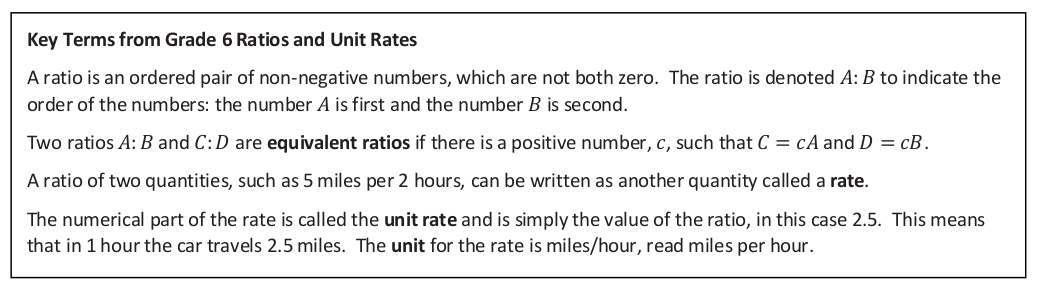
S.4 Example 1
Example 1 Continued – Discussion
- Does everyone pay the same cost per ounce? How do you know?
- Isabelle’s brother takes an extra-long time to create his dish. When he puts it on the scale, it weighs 15 ounces.
If everyone pays the same rate in this store, how much will his dish cost? How did you calculate this cost?
- What happens if you don’t serve yourself any yogurt or toppings, how much do you pay?
- And does the relationship above still hold true? In other words, if you buy 0 ounces of yogurt, then multiply by
the cost per ounce, do you get 0?
- You always multiply the number of ounces, x, by the constant that represents cost per ounce, to get the total
cost, y.
![]()
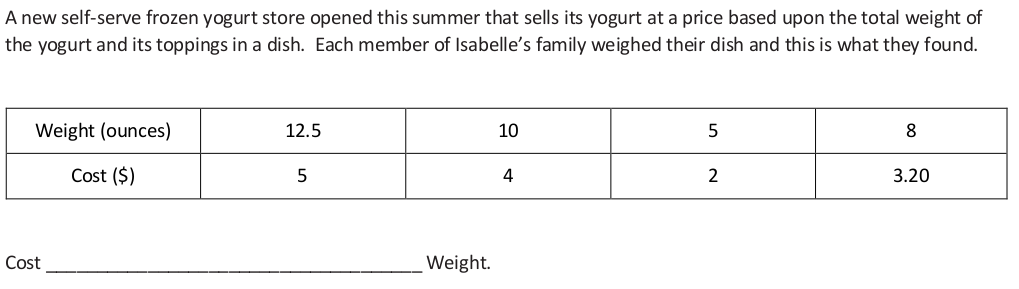
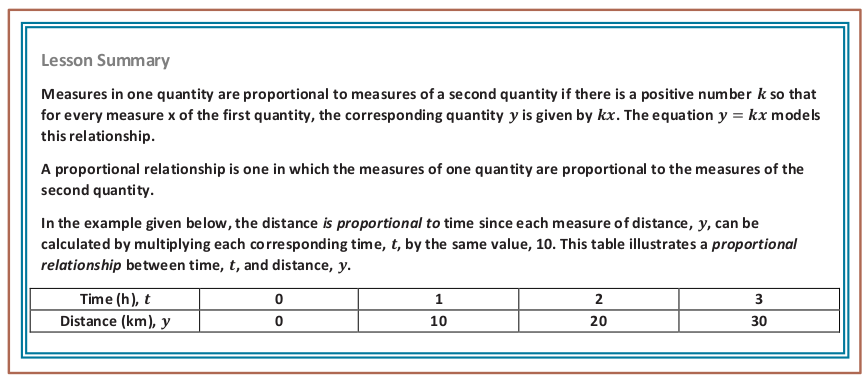
S.4 Example 2
- What does the diagram tell us?
- Is the number of ounces proportional to the number of cups? How do you know?
- How many ounces are there in 4 cups? 5 cups? 8 cups? How do you know?
- Adding x and y variables – For any number of cups x, how do we find the number of ounces, y?
- Can we write an expression in terms of x and y?
- How can we verify our equation?
![]()
S.4 Exercise 1 (Independent Work)
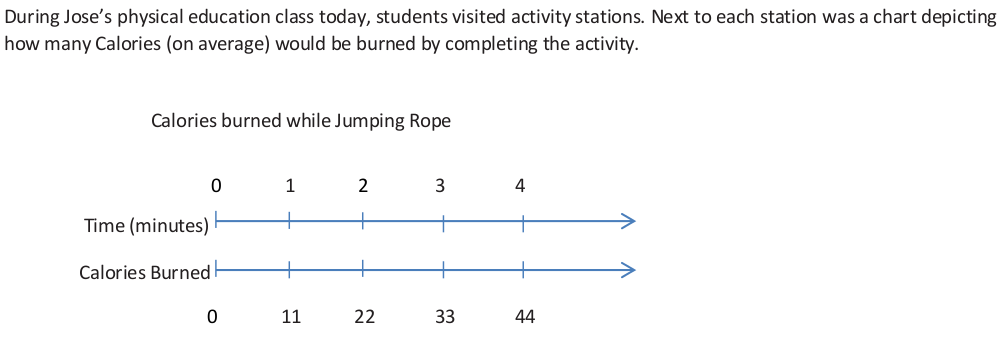
1. Is the number of Calories burned proportional to time? How do you know?
2. If Jose jumped rope for 6.5 minutes, how many calories would he expect to burn?
![]() S.6 Example 3 (Partner Work)
S.6 Example 3 (Partner Work)
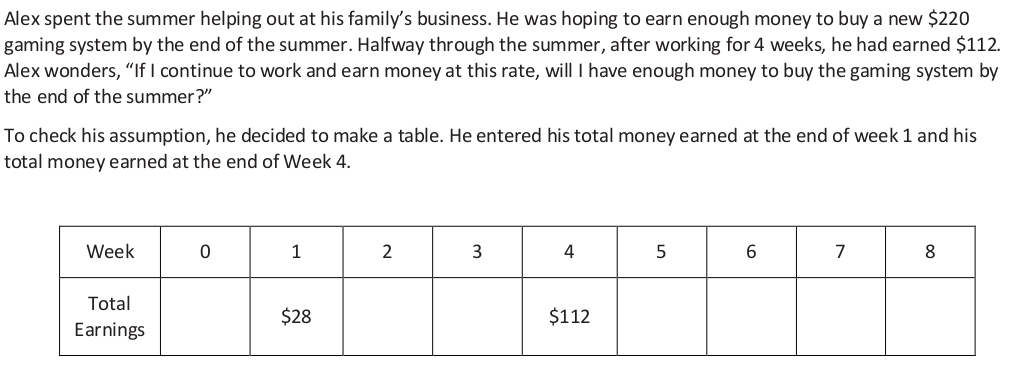
1. Work with a partner to answer Alex’s question.
2. Are Alex’s total earnings proportional to the number of weeks he worked? How do you know?
Summary
- How do we know if two quantities are proportional to each other?
Two quantities are proportional to each other if there is one constant number that is multiplied by each
measure in the first quantity to give the corresponding measure in the second quantity.
- How can we recognize a proportional relationship when looking at a table or a set of ratios?
If each of the measures in the second quantity is divided by its corresponding measure in the first
quantity and it produces the same number, called a constant, then the two quantities are proportional to each other.
Exit Ticket
Ms. Albero decided to make juice to serve along with the pizza at the Student Government party. The directions said to mix 2 scoops of powdered drink mix with a half a gallon of water to make each pitcher of juice. One of Ms. Albero’s students said she will mix 8 scoops with 2 gallons of water to get 4 pitchers. Is the student correct?
Assignment: Lesson 2 Problem set
[/expand]
[expand title=”Identifying Proportional and Non-proportional Relationships in Tables”]
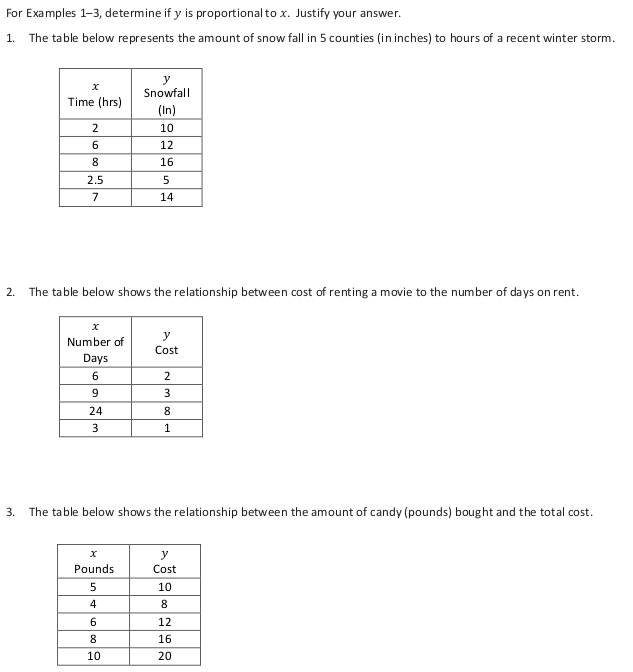
Lesson 3: Identifying Proportional and Non-proportional Relationships In Tables
Example 1
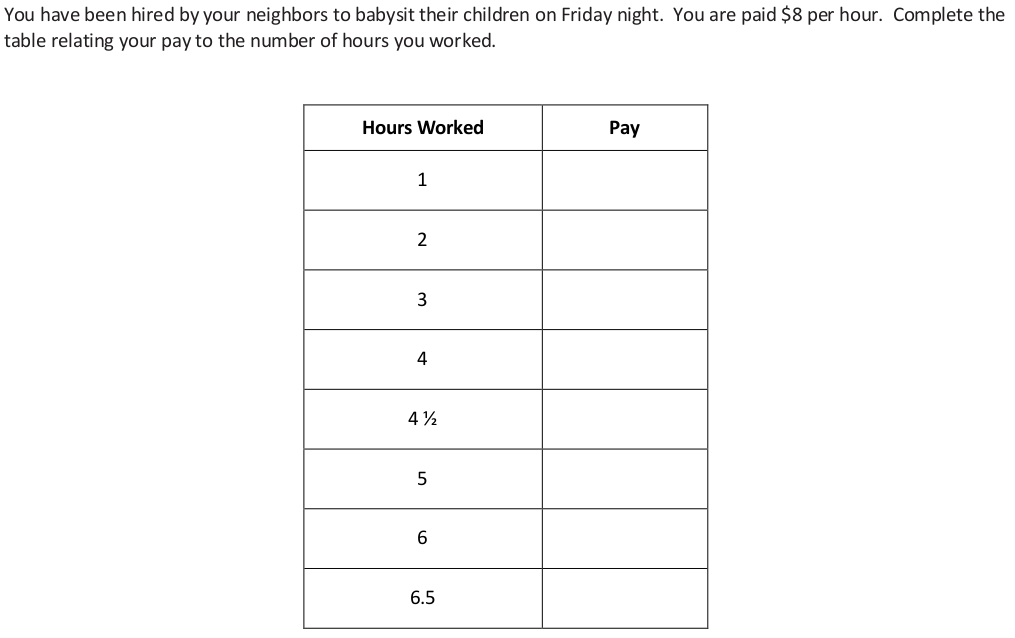
Based on the table above, is the pay proportional to the hours worked? How do you know?
Exercises:
Exit ticket
Assignment: Lesson 3 – Problem Set
7.1.1 Quiz – Ratios and Unit Rate
Lesson 4: Identifying Proportional and Nonproportional Relationships in Tables
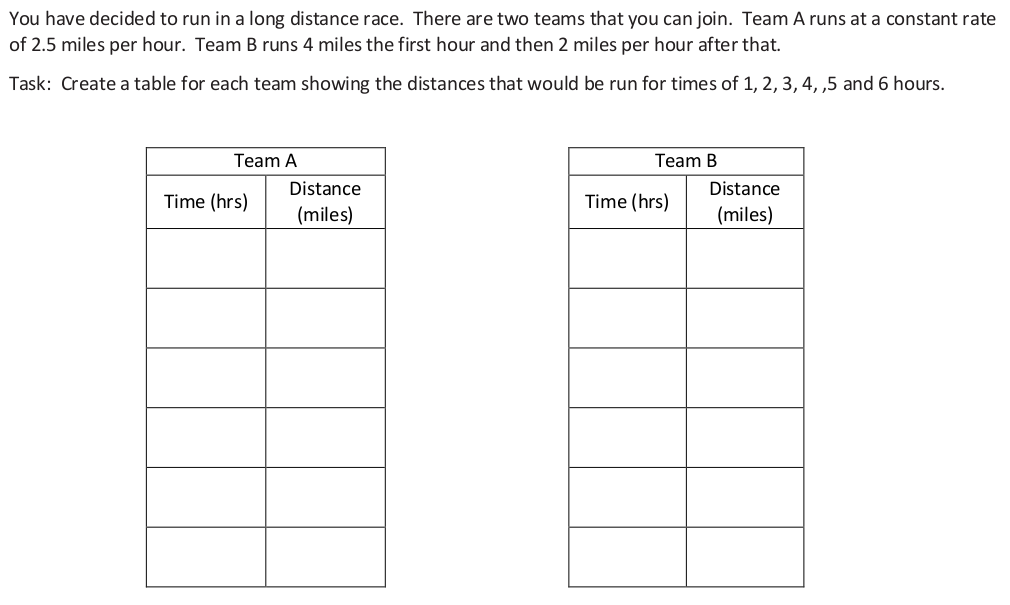
a. For which team is the distance proportional to time? Explain your reasoning.
b. Explain how you know distance for the other team is not proportional to time.
c. At what distance in the race would it be better to be on Team B than Team A? Explain.
d. If the members on each team waked for 10 hours, how far would they have gone?
e. Will there always be a winning team, no matter what the length of the course? Why or why not?
f. If the race is 12 miles long, which team should you choose to be on if you wish to win? Why would you choose this team?
g. How much sooner would you finish on that team compared to the other team?
![]()
Exercises 1-3 (group work)
Assignment: Problem Set 4
[/expand]
[expand title=”Identifying Proportional and Non-Proportional Relationships in Graphs”]
Essential Question: Can we identify a proportional relationship by graphing?
7.RP.2a
7.RP.2d
Opening Exercise
Lesson 5
![]()
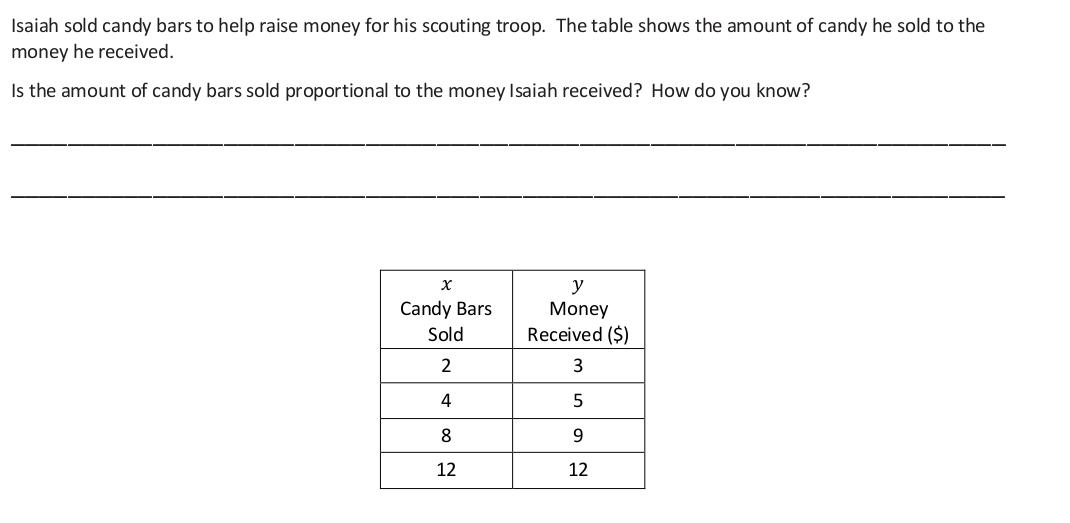
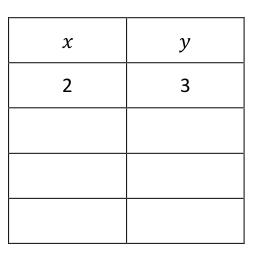
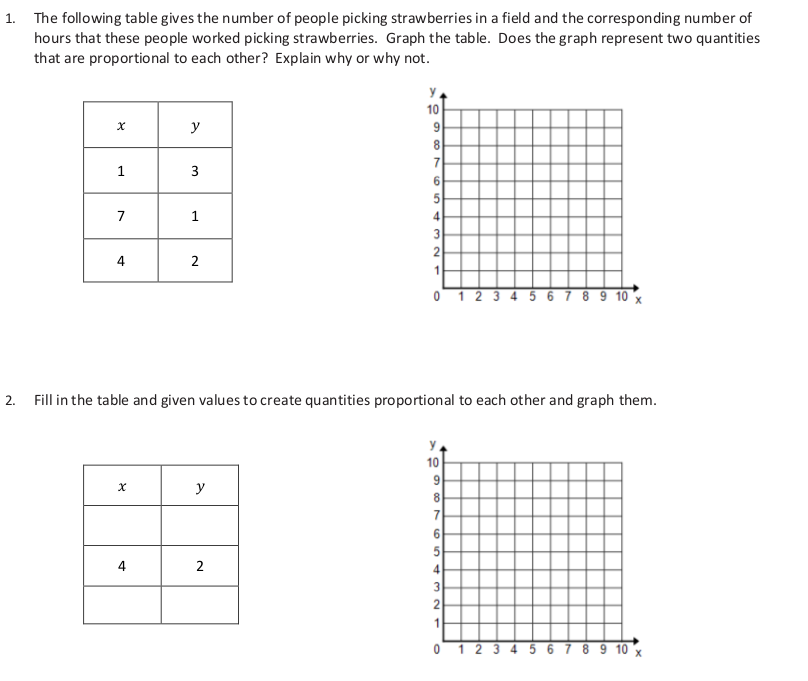
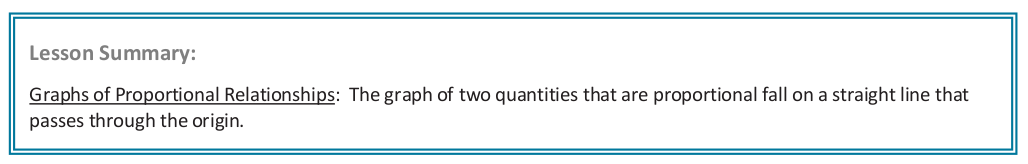
S.16 Example 1: From Table to Graph
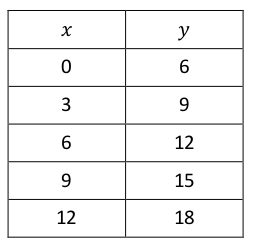
- Using the ratio provided, create a table that shows money received is proportional to the number of candy bars sold.
- Plot the points in your table on the grid.
- What is the origin and where is it located?
- Why are we going to focus on quadrant 1?
- What should we label the x-axis and y-axis?
- Could it be the other way around?
- How do we plot the first ratio pair?
Plot all points on graph
- What observations can you make about the arrangement of points?
- Do we extend the line in both directions? Explain why or why not.
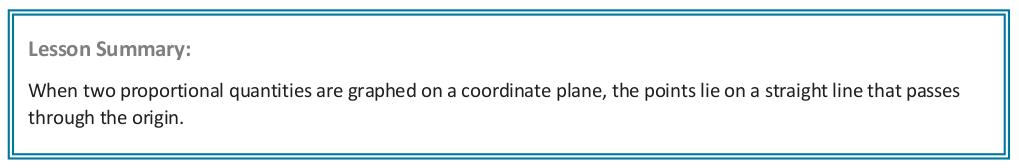
- Would all proportional relationships pass through the origin?
- What can you infer about graphs of two quantities that are proportional to each other?
![]()
S.17 Example 2-3
Complete both examples independently.
Example 2
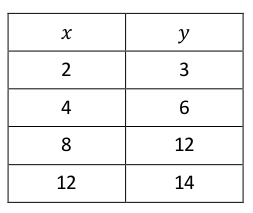
- Does the ratio table represent quantities that are proportional to each other?
- From this example, what is important to note about graphs of two quantities that are not proportional to each other?
Example 3
- How are the graphs of the data in examples 1 and 3 similar? How are they different?
- What are the similarities of the graphs of two quantities that are proportional to each other and graphs of two quantities that are not shared?
Assignment: Lesson 5 Problem Set
Exit Ticket
Lesson 6
Preparation
This lesson will be a group activity in which you will create a poster to represent your work and solution for a given problem. Each group member will have a role.
- Facilitator: responsible for all materials used by the group.
- Recorder: responsible for writing/documenting the group’s work.
- Reader: will read all information the group is provided and handle instructions.
- Reporter: responsible for reporting the groups findings and poster to the class.
The specific roles/responsibilities for this activity:
- Recorder: Fold paper into quarters and label (see S.20).
- Reader: Take out Contents of envelopes and instruct group members to arrange them on the table and graph.
- Reader: Read the problem to the group.
- Group members: use multiple methods to show whether the quantities represented in the envelope are proportional to each other or not.
Collaboration
- Discuss the given problem and and record responses on poster (15 minutes)
- Hang posters on wall
- Circulate and find the group with the same ratio and discuss similarities and differences in posters.
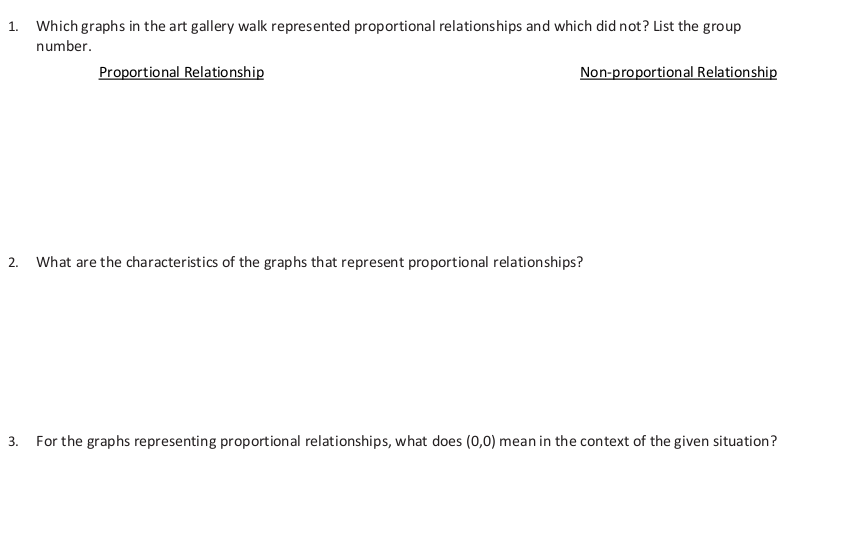
Gallery Walk
- With your group, circulate and answer the following questions in student workbook (S.21):
- Were there any differences found in groups that had the same ratios?
- Did you notice any common mistakes? How might they be fixed?
- Was there a group that stood out by representing their problems and findings exceptionally clearly?
Assignment: Lesson 6 Problem Set
Exit
[/expand]
[expand title=”Formative Assessment”]
- 7.1.Asmnt-Gym Memberships
- IM (82, 470, 828)
[/expand]
[expand title=”Resources”]
ENY.7.1.5
ENY.7.1.6.Challenge
Glencoe: 4-2 Ex 1-2
Glencoe: 4-2 (1-19)
Glencoe: 4-10 Ex 2-3
Glencoe: 4-10 (11-16, 23-24)
[/expand]