Essential Question: Can we identify the unit rate from a graph of a proportional relationship?
7.RP.2d
[expand title=”Warm up”]
Grandma’s Special Chocolate Chip Cookie recipe, which yields 4 dozen cookies, calls for 3 cups of flour.
- Create a table based upon this relationship.
- Find the values for at least 3 additional quantities of cookies.
[/expand]
[expand title=”Lesson”]
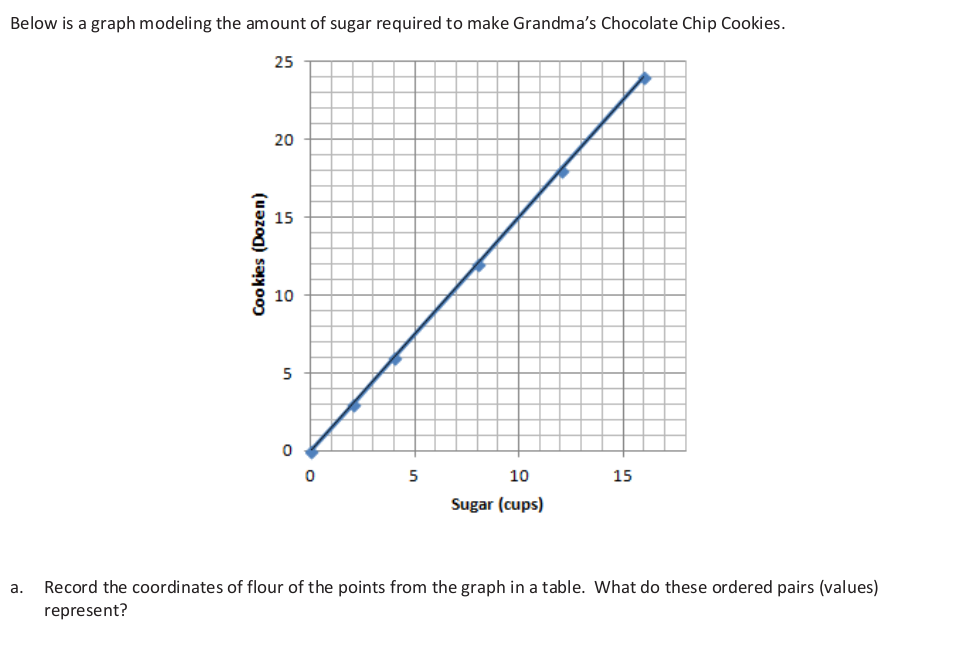
![]() S.37 Example 1
S.37 Example 1

![]()
S.38 Example 2 (Partner Work)
Discussion
- What quantity is measured along the horizontal axis?
- When you plot the ordered pair (A, B), what does A represent?
- What quantity is measured along the vertical axis?
- When you plot the point (A, B), what does B represent?
- What is the unit rate for this proportional relationship?
- How is the unit rate related to the graph?
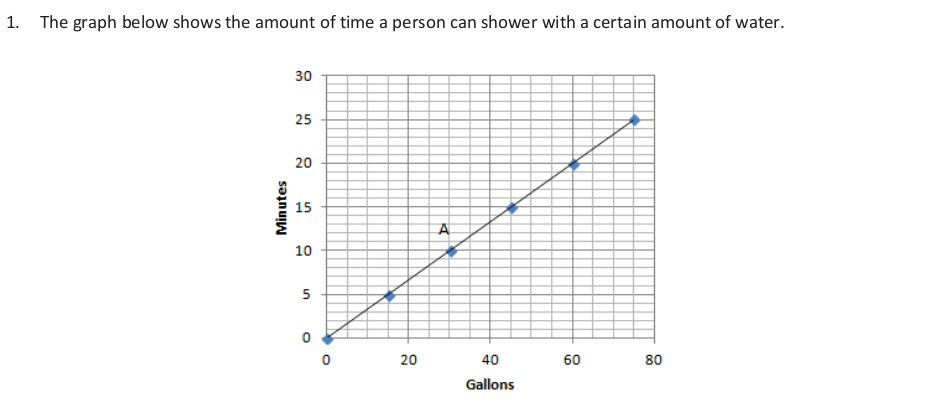
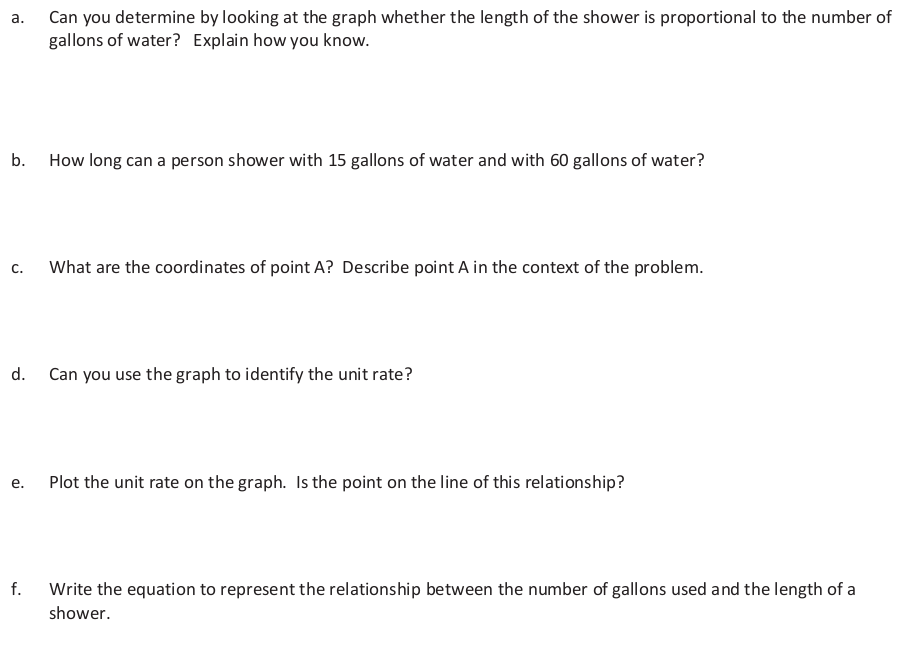
![]() S.39-41 Exercise 1-2 (Partner Work)
S.39-41 Exercise 1-2 (Partner Work)
[/expand]
[expand title=”Summary”]
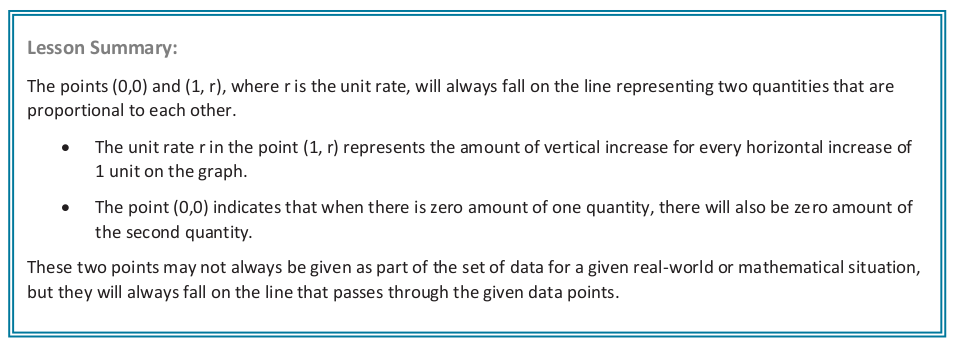
[/expand]
[expand title=”Problems”]
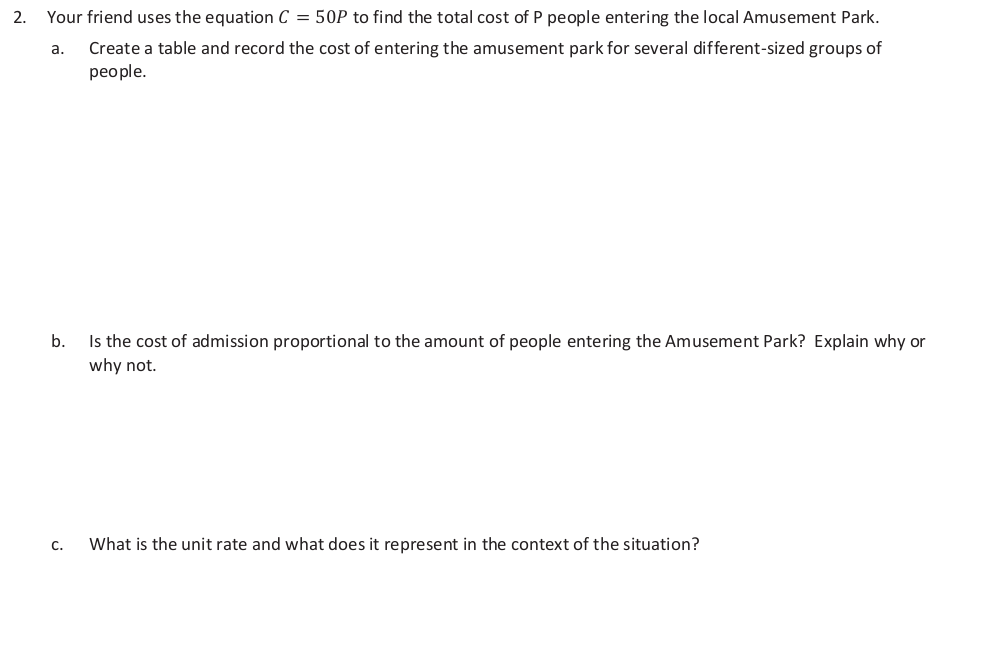
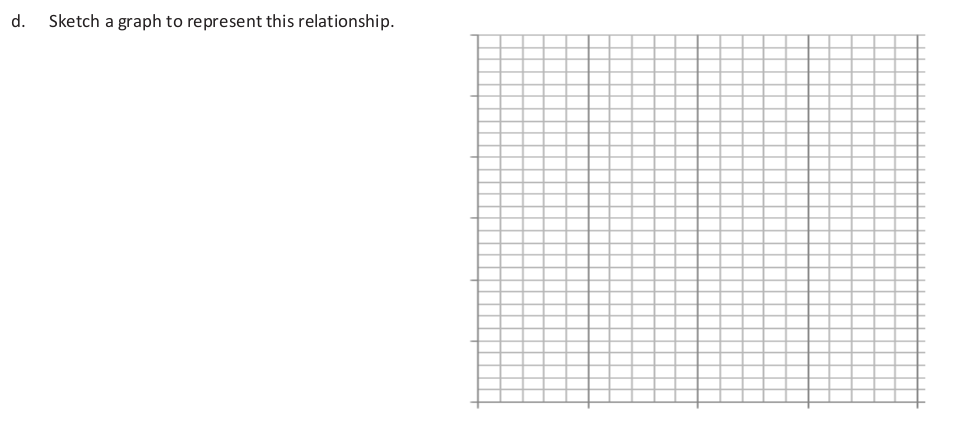
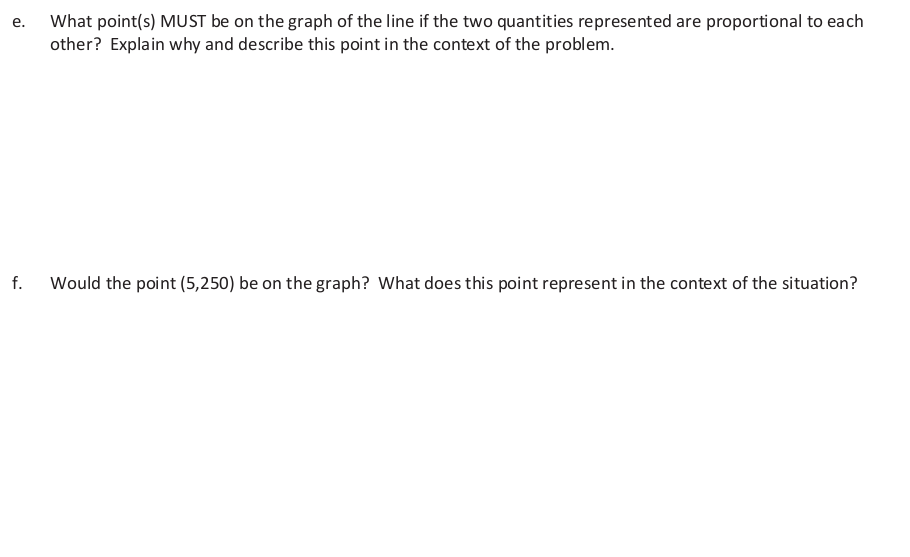
![]() S.42-44
S.42-44
[/expand]
[expand title=”Exit”]
[/expand]