Essential Question: How do we graphically represent a non-linear relationship between two quantities?
[expand title=”Warm up”]
- Describe the motion of the ball in words (focus on speed, distance, and time).
- Can you graph your observations?
[/expand]
[expand title=”Lesson”]
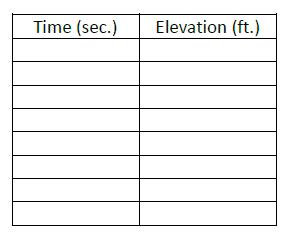
![]() S.5 Example 2
S.5 Example 2
Closer look (0:46-0:55): Half speed
Adjusting to real time
- The clip shown is half speed. What would you need to do to this graph to correctly model the jump with a graph?
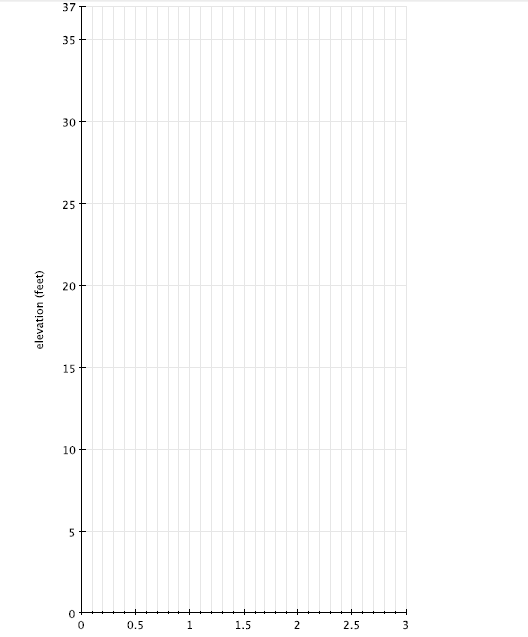
![]()
S.6 Example 3 (Partner Work)
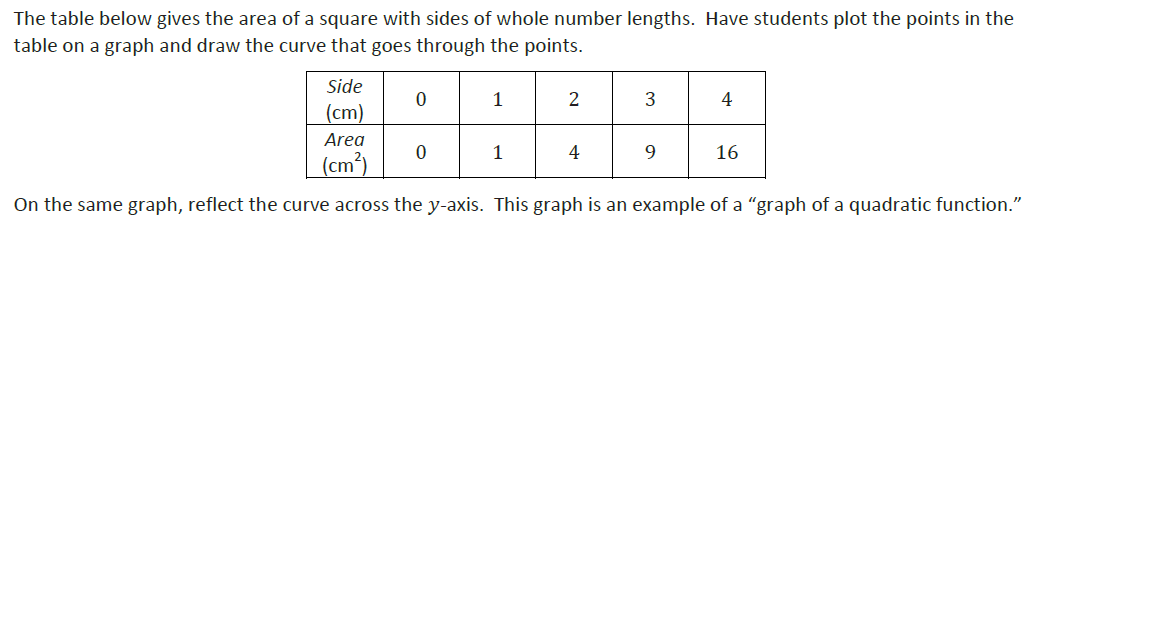
- What do the points between the plotted points from the table represent?
- What type of function is this graph an example of?
[/expand]
[expand title=”Problems”]
![]() S.7-9
S.7-9
[/expand]
[expand title=”Exit”]
[/expand]