Essential Question: How do we represent exponential functions graphically?
[expand title=”Warm up”]
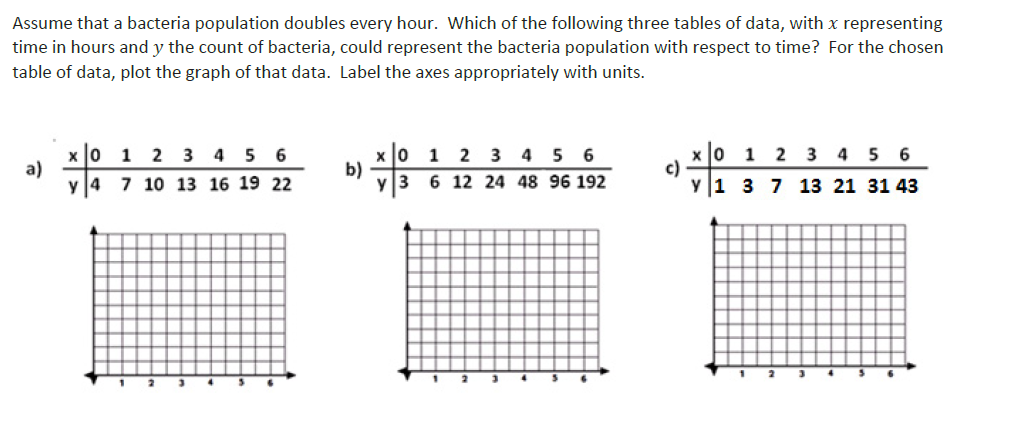
![]() S.10 Example 1
S.10 Example 1

[/expand]
[expand title=”Lesson”]
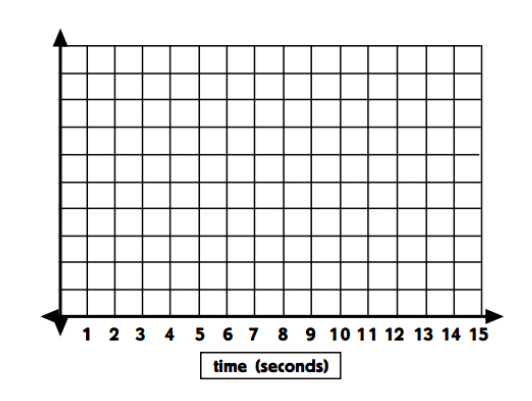
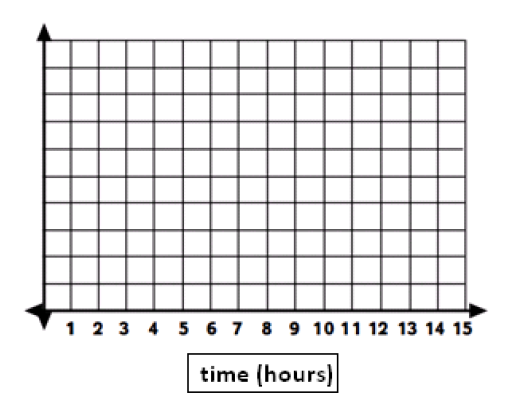
S.11 Example 2: Bacteria Growth![]()
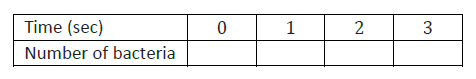
- If we continued this table to 4 seconds, how many bacteria would you expect to see?
- What about 5 seconds?
- Will the curve ever be perfectly vertical?
- Adjust to real time: The narrator said, “Just one bacterium, dividing every 20 minutes…” How much time passed in the video? How do we adjust out table and graph?
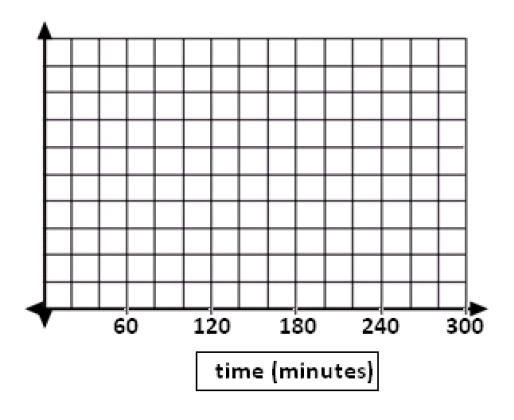
- What scale should we use for the vertical axis?
- How can we estimate the number of bacteria at greater time intervals?
- What does the curve represent between the points?
[/expand]
[expand title=”Problems”]
![]() S.13-15
S.13-15
[/expand]
[expand title=”Exit”]
[/expand]