Essential Question: Can we identify a proportional relationship by graphing?
7.RP.2a
7.RP.2d
[expand title=”Warm up”]
![]() S.16
S.16
[/expand]
[expand title=”Lesson 5″]
![]()
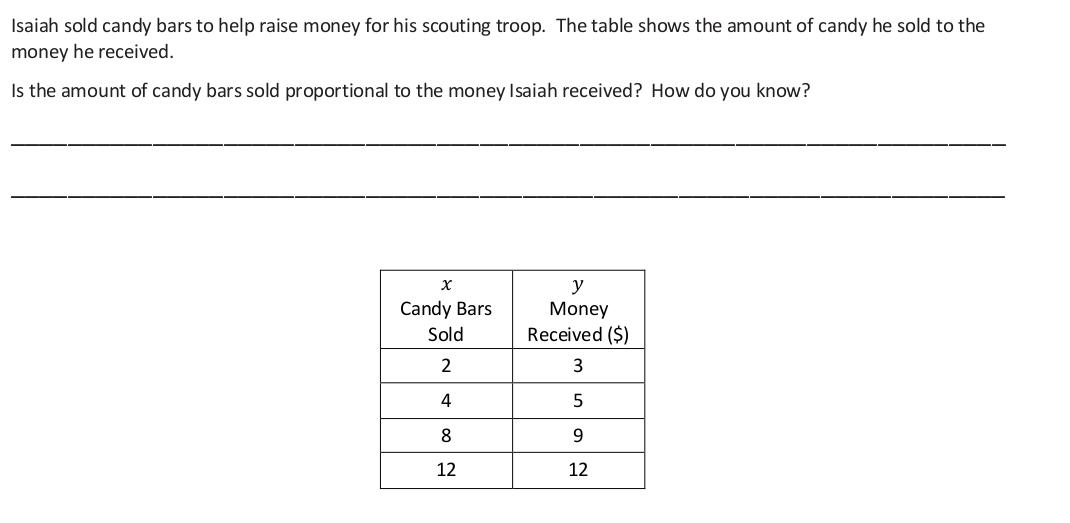
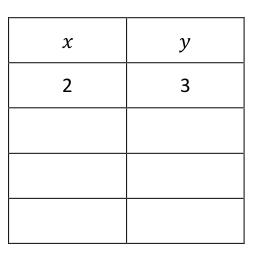
S.16 Example 1: From Table to Graph
- Complete the table with two sets of quantities that are proportional to eachother
- What is the origin and where is it located?
- Why are we going to focus on quadrant 1?
- What should we label the x-axis and y-axis?
- Could it be the other way around?
- How do we plot the first ratio pair?
Plot all points on graph
- What observations can you make about the arrangement of points?
- Do we extend the line in both directions? Explain why or why not.
- Would all proportional relationships pass through the origin?
- What can you infer about graphs of two quantities that are proportional to each other?
![]()
S.17 Example 2-3
Complete both examples independently.
Example 2
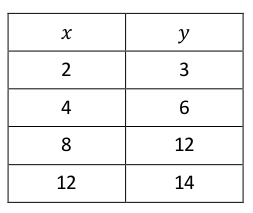
- Does the ratio table represent quantities that are proportional to each other?
- From this example, what is important to note about graphs of two quantities that are not proportional to each other?
Example 3
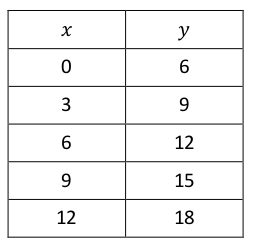
- How are the graphs of the data in examples 1 and 3 similar? How are they different?
- What are the similarities of the graphs of two quantities that are proportional to each other and graphs of two quantities that are not shared?
[/expand]
[expand title=”Summary”]
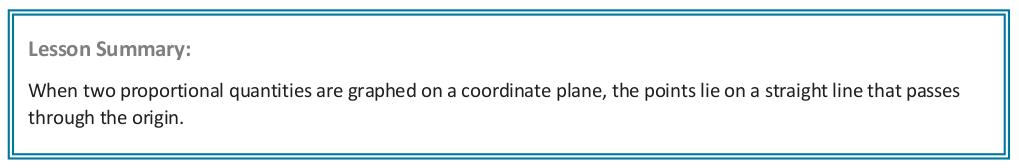
[/expand]
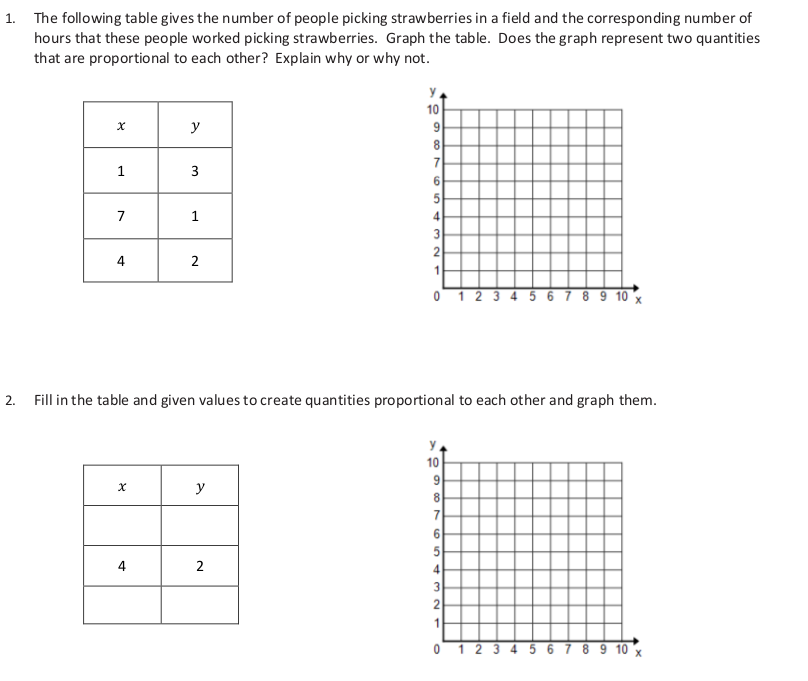
[expand title=”Problems”]
![]() S.18-19
S.18-19
[/expand]
[expand title=”Exit”]
[/expand]
[expand title=”Lesson 6″]
Preparation
This lesson will be a group activity in which you will create a poster to represent your work and solution for a given problem. Each group member will have a role.
- Facilitator: responsible for all materials used by the group.
- Recorder: responsible for writing/documenting the group’s work.
- Reader: will read all information the group is provided and handle instructions.
- Reporter: responsible for reporting the groups findings and poster to the class.
The specific roles/responsibilities for this activity:
- Recorder: Fold paper into quarters and label (see S.20).
- Reader: Take out Contents of envelopes and instruct group members to arrange them on the table and graph.
- Reader: Read the problem to the group.
- Group members: use multiple methods to show whether the quantities represented in the envelope are proportional to each other or not.
Collaboration
- Discuss the given problem and and record responses on poster (15 minutes)
- Hang posters on wall
- Circulate and find the group with the same ratio and discuss similarities and differences in posters.
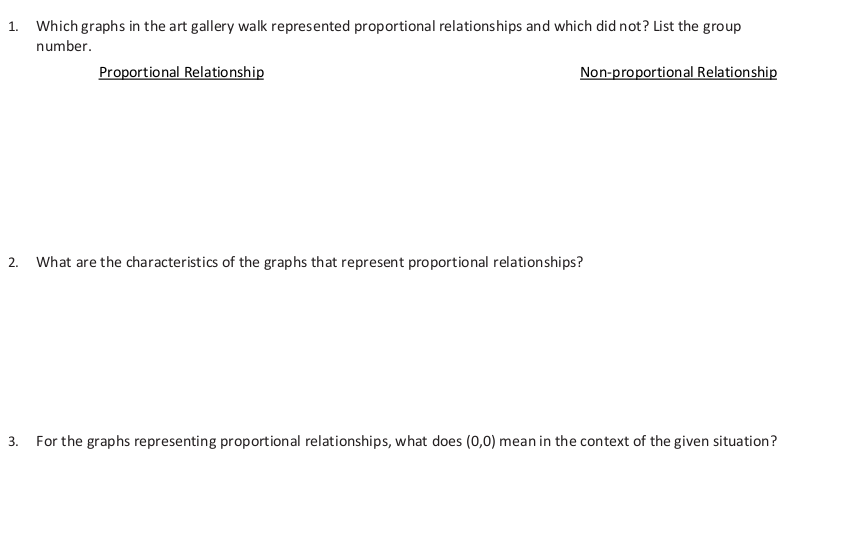
Gallery Walk
- With your group, circulate and answer the following questions in student workbook (S.21):
- Were there any differences found in groups that had the same ratios?
- Did you notice any common mistakes? How might they be fixed?
- Was there a group that stood out by representing their problems and findings exceptionally clearly?
[/expand]
[expand title=”Summary”]
[/expand]
[expand title=”Problems”]
![]() S.22
S.22
[/expand]
[expand title=”Exit”]
[/expand]