Essential Question: How do we discern units for quantities in real-world situations?
[expand title=”Warm up”]
![]() S.16 Example 1
S.16 Example 1
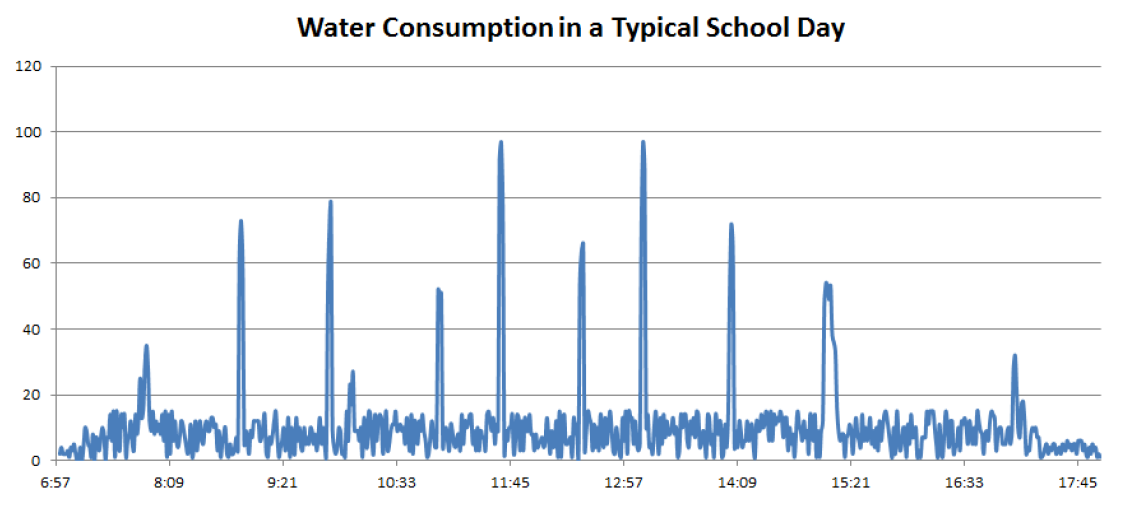
- The title of the graph is “Water Consumption in a Typical School Day.” For what purposes is water used at a school?
- What do you think the numbers along the horizontal axis represent?
- What might the numbers along the vertical axis represent? Do we have any indication of the units being used?
- What could be the reason for the “spikes” in the graph?
- What might be the reason for the smaller spikes between the large ones?
[/expand]
[expand title=”Lesson”]
![]() Example 1: Continued
Example 1: Continued
Additional Information:
- Regular school day hours: 8:00 a.m. – 3:04 p.m.
- After school activities: 3:15 p.m. – 5:15 p.m.
- Around 10:00 a.m. there is a 13 minute advisory/homeroom period.
Can you see features of this information appearing in the graph?
- Around 10:00 a.m. the graph indicates a peak of 80 units. What is the number 80 representing?
- What are the units for the numbers on the vertical axis?
- Ignoring the large spikes, what seems to be the typical water usage throughout the day?
![]() S.16 Exercise 1 (Group Work)
S.16 Exercise 1 (Group Work)
The bulk of water usage is due to the flushing of toilets. Each flush uses 2.5 gallons of water. Samson estimates that 2% of the school population uses the bathroom between 10:00 a.m. and 10:01 a.m. right before homeroom. What is a good estimate of the population of the school?
![]()
S.17 Example 2 (Partner Work)
Samson then wonders this: If everyone at the school flushed a toilet at the same time, how much water would go down the drain (if the water-pressure of the system allowed)? Are we able to find an answer for Samson?
![]()
S.17 Example 3 (Partner Work)
Estimation Exercise
- Make a guess as to how many toilets are at the school.
- Make a guess as to how many students are in the school, and what percentage of students might be using the bathroom at break times between classes, just before the start of school, and just after the end of school. Are there enough toilets for the count of students wishing to use them?
- Using the previous two considerations, estimate the number of students using the bathroom during the peak minute of each break.
- Assuming each flush uses 2.5 gallons of water, estimate the amount of water being used during the peak minute of each break.
- What time of day do these breaks occur? (If the school schedule varies, consider today’s schedule.)
- Draw a graph that could represent the water consumption in a typical school day of your school.
[/expand]
[expand title=”Problems”]
![]()
S.18-20
[/expand]
[expand title=”Exit”]
[/expand]