[expand title=”What is chance?”]
Have you ever heard a weatherman say there is a 40% chance of rain tomorrow or a football referee tell a team there is a 50/50 chance of getting a heads on a coin toss to determine which team starts the game? These are probability statements. In this lesson, you are going to investigate probability and how likely it is that some events will occur.
Spinner Game
Rules of the game:
- Decide who will go first.
- Each person picks a color. Both players cannot pick the same color.
- Each person takes a turn spinning the spinner and recording what color the spinner stops on. The winner is the person whose color is the first to happen 10 times.
Play the game, and remember to record the color the spinner stops on for each spin.
Exercises 1–4
- Which color was the first to occur 10 times?
- Do you think it makes a difference who goes first to pick a color?
- Which color would you pick to give you the best chance of winning the game? Why would you pick that color?
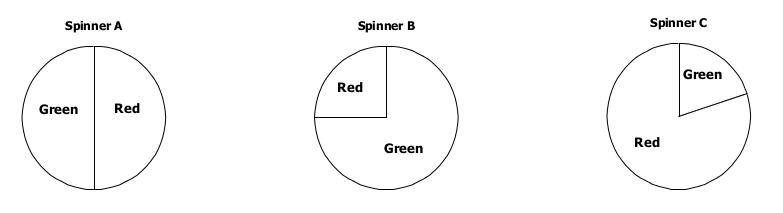
- Below are three different spinners. On which spinner is the green likely to win, unlikely to win, and equally likely to win?
Example 2: What is Probability?
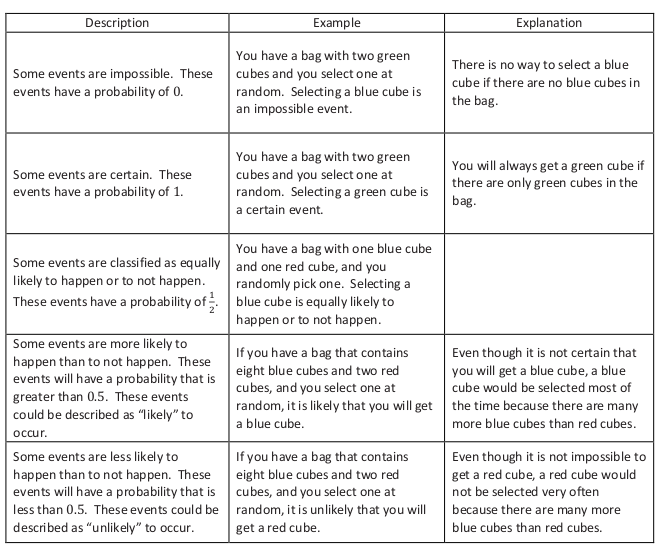
Probability is a measure of how likely it is that an event will happen. A probability is indicated by a number between 0 and 1. Some events are certain to happen, while others are impossible. In most cases, the probability of an event happening is somewhere between certain and impossible.
What are some examples of numbers between 0 and 1?
For example, consider a box that contains only red cubes. If you were to select one cube from the bag, you are certain to pick a red one. We say that an event that is certain to happen has a probability of 1. If we were to reach into the same bag of cubes, it is impossible to select a yellow cube. An impossible event has a probability of 0.
- Design a spinner so that the probability of spinning green is 1.
- Design a spinner so that the probability of spinning green is 0.
- Design a spinner with two outcomes in which it is equally likely to land on the red and green parts.
[/expand]
[expand title=”Probability Scale”]
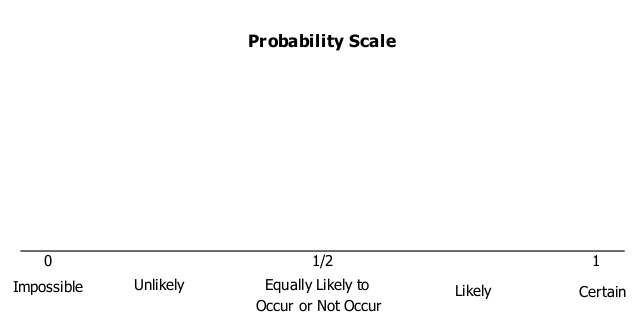
The figure below shows the probability scale.
Using a Probability Scale
Decide where each event would be located on the scale above. Place the letter for each event on the appropriate place on the probability scale.
Event:
A. You will see a live dinosaur on the way home from school today.
B. A solid rock dropped in the water will sink.
C. A round disk with one side red and the other side yellow will land yellow side up when flipped.
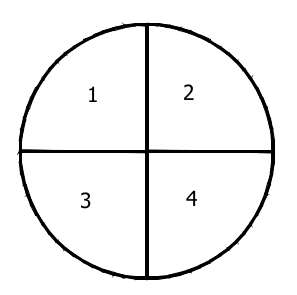
D. A spinner with four equal parts numbered 1–4 will land on the 4 on the next spin.
E. Your full name will be drawn when a full name is selected randomly from a bag containing the full names of all of the students in your class.
F. A red cube will be drawn when a cube is selected from a bag that has five blue cubes and five red cubes.
G. Tomorrow the temperature outside will be -250 degrees.
An event that is impossible has a probability of 0 and will never occur, no matter how many observations you make. This means that in a long sequence of observations, it will occur 0% of the time. An event that is certain has a probability of 1 and will always occur. This means that in a long sequence of observations, it will occur 100% of the time.
What do you think it means for an event to have a probability of ?
What do you think it means for an event to have a probability of ?
Decide where each of the following events would be located on the scale below. Place the letter for each event on the appropriate place on the probability scale.
The numbers from 1 to 10 are written on small pieces of paper and placed in a bag. A piece of paper will be drawn from the bag.
A. A piece of paper with a 5 is drawn from the bag.
B. A piece of paper with an even number is drawn.
C. A piece of paper with a 12 is drawn.
D. A piece of paper with a number other than 1 is drawn.
E. A piece of paper with a number divisible by 5 is drawn.
[/expand]
[expand title=”Collecting data and estimating”]
Example 1: Carnival Game
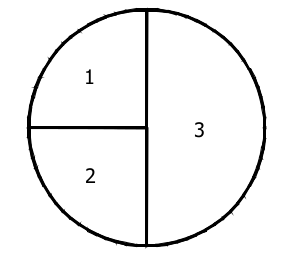
At the school carnival, there is a game in which students spin a large spinner. The spinner has four equal sections numbered 1–4 as shown below. To play the game, a student spins the spinner twice and adds the two numbers that the spinner lands on. If the sum is greater than or equal to 5, the student wins a prize.
Exercises 1–8
You and your partner will play this game 15 times. Record the outcome of each spin in the table below.
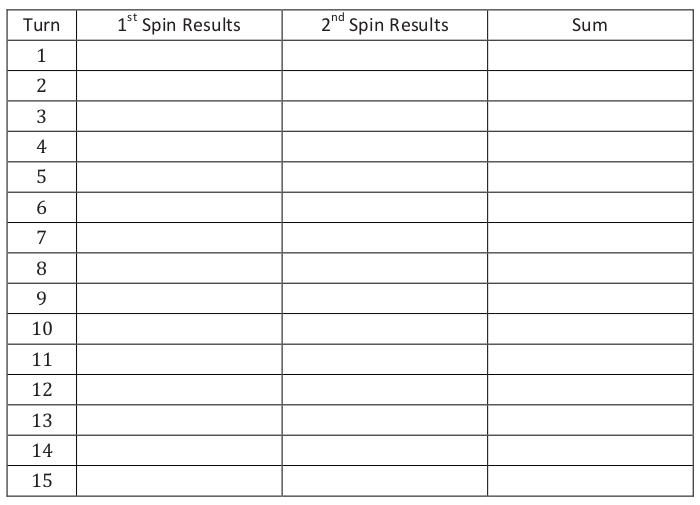 1. Out of the 15 turns how many times was the sum greater than or equal to 5?
2. What sum occurred most often?
3. What sum occurred least often?
4. If students were to play a lot of games, what proportion of the games would they win? Explain your answer.
5. Name a sum that would be impossible to get while playing the game.
6. What event is certain to occur while playing the game?
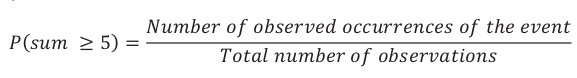
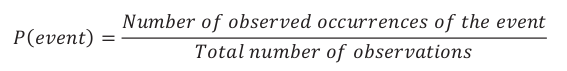
When you were spinning the spinner and recording the outcomes, you were performing a chance experiment. You can use the results from a chance experiment to estimate the probability of an event. In the example above, you spun the spinner 15 times and counted how many times the sum was greater than or equal to 5. An estimate for the probability of a sum greater than or equal to 5 is
7. Based on your experiment of playing the game, what is your estimate for the probability of getting a sum of 5 or more?
8. Based on your experiment of playing the game, what is your estimate for the probability of getting a sum of exactly 5?
Example 2: Animal Crackers
A student brought a very large jar of animal crackers to share with students in class. Rather than count and sort all the different types of crackers, the student randomly chose 20 crackers and found the following counts for the different types of animal crackers. Estimate the probability of selecting a zebra.
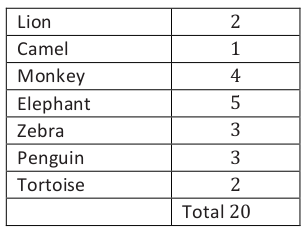
The student can now use that data to find an estimate for the probability of choosing a zebra from the jar by dividing the observed number of zebras by the total number of crackers selected. The estimated probability of picking a zebra is 320, or 0.15 or 15%. This means that an estimate of the proportion of the time a zebra will be selected is 0.15, or 15% of the time. This could be written as P(zebra) = 0.15, or the probability of selecting a zebra is 0.15.
Exercises 9–15
If a student randomly selected a cracker from a large jar:
9. What is your estimate for the probability of selecting a lion?
10. What is your estimate for the probability of selecting a monkey?
11. What is your estimate for the probability of selecting a penguin or a camel?
12. What is your estimate for the probability of selecting a rabbit?
13. Is there the same number of each kind of animal cracker in the large jar? Explain your answer.
14. If the student randomly selected another 20 animal crackers, would the same results occur? Why or why not?
15. If there are 500 animal crackers in the jar, how many elephants are in the jar? Explain your answer.
In the following problems, round all of your decimal answers to 3 decimal places. Round all of your percents to the nearest tenth of a percent. A student randomly selected crayons from a large bag of crayons. Below is the number of each color the student selected. Now, suppose the student were to randomly select one crayon from the bag.
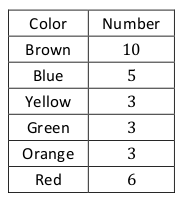
1. What is the estimate for the probability of selecting a blue crayon from the bag? Express your answer as a fraction, decimal or percent.
2. What is the estimate for the probability of selecting a brown crayon from the bag?
3. What is the estimate for the probability of selecting a red crayon or a yellow crayon from the bag?
4. What is the estimate for the probability of selecting a pink crayon from the bag?
5. Which color is most likely to be selected?
6. If there are 300 crayons in the bag, how many will be red? Justify your answer.
Histogram – Bar Graph
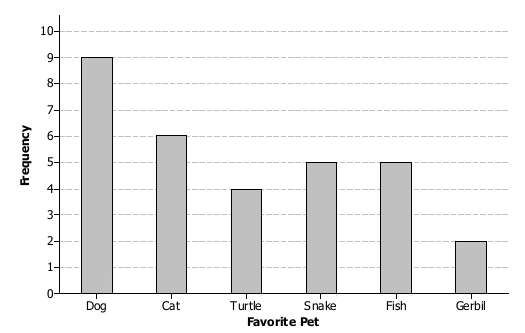
A seventh-grade student surveyed students at her school. She asked them to name their favorite pet. Below is a bar graph showing the results of the survey.
Use the results from the survey to answer the following questions.
- How many students answered the survey question?
- How many students said that a snake was their favorite pet?
Now suppose a student will be randomly selected and asked what his favorite pet is.
- What is your estimate for the probability of that student saying that a dog is his favorite pet?
- What is your estimate for the probability of that student saying that a gerbil is his favorite pet?
- What is your estimate for the probability of that student saying that a frog is his favorite pet?
A seventh grade student surveyed 25 students at her school. She asked them how many hours a week they spend playing a sport or game outdoors. The results are listed in the table below.
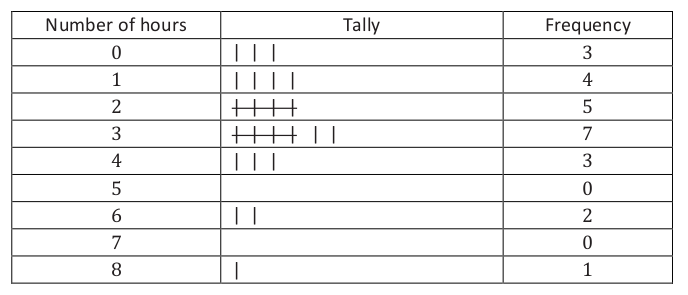
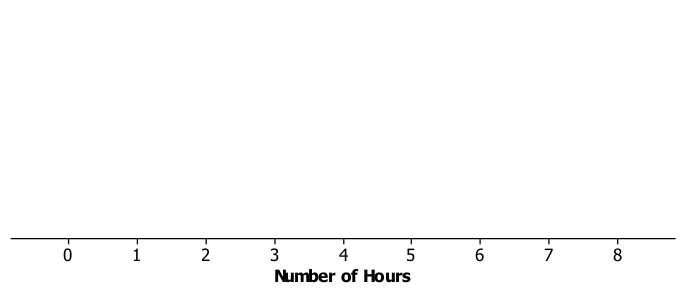
Draw a Dot Plot of the results:
Assignment: Wkst-balls-spinner
Assignment: 7.5.1.ProblemSet
[/expand]
[expand title=”Chance experiments – equally and unequally likely outcomes”]
Example 1
Jamal, a seventh grader, wants to design a game that involves tossing paper cups. Jamal tosses a paper cup five times and records the outcome of each toss. An outcome is the result of a single trial of an experiment.
Here are the results of each toss:

Jamal noted that the paper cup could land in one of three ways: on its side, right side up, or upside down. The collection of these three outcomes is called the sample space of the experiment. The sample space of an experiment is the set of all possible outcomes of that experiment.
For example, the sample space when flipping a coin is heads, tails.
The sample space when drawing a colored cube from a bag that has 3 red, 2 blue, 1 yellow, and 4 green cubes is red, blue, yellow, green.
Exercises 1–6
For each of the following chance experiments, list the sample space (i.e., all the possible outcomes).
- Drawing a colored cube from a bag with 2 green, 1 red, 10 blue, and 3 black.
- Tossing an empty soup can to see how it lands.
- Shooting a free-throw in a basketball game.
- Rolling a number cube with the numbers 1–6 on its faces.
- Selecting a letter from the word probability.
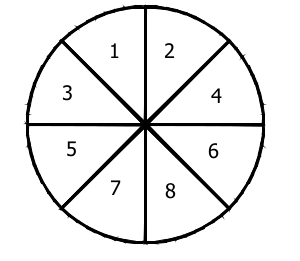
- Spinning the spinner:
Example 2: Cup Toss
The sample space for the paper cup toss was on its side, right side up, and upside down. Do you think each of these outcomes has the same chance of occurring? If they do, then they are equally likely to occur.
The outcomes of an experiment are equally likely to occur when the probability of each outcome is equal.
Toss the paper cup 30 times and record in a table the results of each toss.
Exercises
- Using the results of your experiment, what is your estimate for the probability of a paper cup landing on its side?
- Using the results of your experiment, what is your estimate for the probability of a paper cup landing upside down?
- Using the results of your experiment, what is your estimate for the probability of a paper cup landing right side up?
- Based on your results, do you think the three outcomes are equally likely to occur?
Using the spinner below, answer the following questions.
 Are the events spinning and landing on 1 or 2 equally likely?
- Are the events spinning and landing on 2 or 3 equally likely?
- How many times do you predict the spinner will land on each section after 100 spins?
Assignment: 7.5.3.ProblemSet
[/expand]
[expand title=”Chance experiments with equally likely outcomes”]
Example 1: Bag of Cubes
In a previous lesson, you saw that to find an estimate of the probability of an event for a chance experiment you divide
Your teacher has a bag with some cubes colored yellow, green, blue, and red. The cubes are identical except for their color. Your teacher will conduct a chance experiment by randomly drawing a cube with replacement from the bag. Record the outcome of each draw in the table below.
- Based on the 20 trials, estimate for the probability of
- choosing a yellow cube.
- choosing a green cube.
- choosing a red cube.
- choosing a blue cube.
- If there are 40 cubes in the bag, how many cubes of each color are in the bag? Explain.
- If your teacher were to randomly draw another 20 cubes one at a time and with replacement from the bag, would you see exactly the same results? Explain.
- Find the fraction of each color of cubes in the bag.
Yellow
Green
Red
Blue
Each fraction is the theoretical probability of choosing a particular color of cube when a cube is randomly drawn from the bag. When all the possible outcomes of an experiment are equally likely, the probability of each outcome is:
Find the theoretical probabilities for each of the colors:
P(Yellow)=
P(Green)=
P(Red)=
P(Blue)=
Exercises – Sample Spaces
- Consider a chance experiment of rolling a number cube.
- What is the sample space? List the probability of each outcome in the sample space.
- What is the probability of rolling an odd number?
- What is the probability of rolling a number less than 5?
- Consider an experiment of randomly selecting a letter from the word number.
- What is the sample space? List the probability of each outcome in the sample space.
- What is the probability of selecting a vowel?
- What is the probability of selecting the letter z?
Assignment: 7.5.4.ProblemSet
[/expand]
[expand title=”Chance experiments with unequally likely outcomes”]
In previous lessons, you learned that when the outcomes in a sample space are equally likely, the probability of an event is the number of outcomes in the event divided by the number of outcomes in the sample space. However, when the outcomes in the sample space are not equally likely, we need to take a different approach.
Example 1
When Jenna goes to the farmer’s market she usually buys bananas. The number of bananas she might buy and their probabilities are shown in the table below.
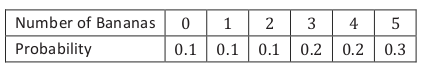
- What is the probability that Jenna buys exactly 3 bananas?
- What is the probability that Jenna doesn’t buy any bananas?
- What is the probability that Jenna buys more than 3 bananas?
- What is the probability that Jenna buys at least 3 bananas?
- What is the probability that Jenna doesn’t buy exactly 3 bananas?
Notice that the sum of the probabilities in the table is one whole (0.1+0.1+0.1+0.2+0.2+0.3=1). This is always true; when we add up the probabilities of all the possible outcomes, the result is always 1. So, taking 1 and subtracting the probability of the event gives us the probability of something NOT occurring.
Exercises 1–2
Jenna’s husband, Rick, is concerned about his diet. On any given day, he eats 0, 1, 2, 3, or 4 servings of fruit and vegetables. The probabilities are given in the table below.

- On a given day, find the probability that Rick eats:
- Two servings of fruit and vegetables.
- More than two servings of fruit and vegetables.
- At least two servings of fruit and vegetables.
- Find the probability that Rick does not eat exactly two servings of fruit and vegetables.
Example 2
Luis works in an office, and the phone rings occasionally. The possible number of phone calls he receives in an afternoon and their probabilities are given in the table below.
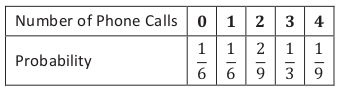
- Find the probability that Luis receives 3 or 4 phone calls.
- Find the probability that Luis receives fewer than 2 phone calls.
- Find the probability that Luis receives 2 or fewer phone calls.
- Find the probability that Luis does not receive 4 phone calls.
Exercises
When Jenna goes to the farmer’s market, she also usually buys some broccoli. The possible number of heads of broccoli that she buys and the probabilities are given in the table below.
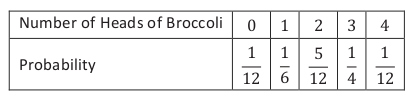
Find the probability that Jenna:
- Buys exactly 3 heads of broccoli.
- Does not buy exactly 3 heads of broccoli.
- Buys more than 1 head of broccoli.
- Buys at least 3 heads of broccoli.
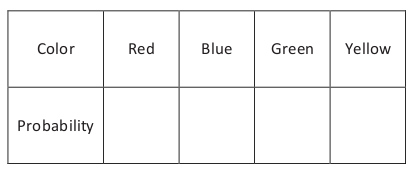
The diagram below shows a spinner designed like the face of a clock. The sectors of the spinner are colored red (R), blue (B), green (G), and yellow (Y).
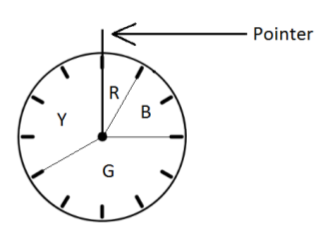
Spin the pointer, and award the player a prize according to the color on which the pointer stops.
- Writing your answers as fractions in lowest terms, find the probability that the pointer stops on the following colors.
- Red:
- Blue:
- Green:
- Yellow:
Complete the table of probabilities below.
 Find the probability that the pointer stops in either the blue region or the green region.
Find the probability that the pointer does not stop in the green region.
Assignment: 7.5.5.ProblemSet
[/expand]
Compound Probability
[expand title=” Using Tree Diagrams to Represent a Sample Space and to Calculate Probabilities“]
Suppose a girl attends a preschool where the students are studying primary colors. To help teach calendar skills, the teacher has each student maintain a calendar in his or her cubby. For each of the four days that they are covering primary colors in class, students get to place a colored dot on their calendar: blue, yellow, or red. When the four days of the school week have passed (Monday–Thursday), what might the young girl’s calendar look like?
One outcome would be four blue dots if the student chose blue each day. But consider that the first day (Monday) could be blue, and the next day (Tuesday) could be yellow, and Wednesday could be blue, and Thursday could be red. Or, maybe Monday and Tuesday could be yellow, Wednesday could be blue, and Thursday could be red. Or, maybe Monday, Tuesday, and Wednesday could be blue, and Thursday could be red, and so on and so forth.
As hard to follow as this seems now, we have only mentioned 3 of the 81 possible outcomes in terms of the four days of colors! Listing the other 78 outcomes would take several pages! Rather than listing outcomes in the manner described above (particularly when the situation has multiple stages, such as the multiple days in the case above), we often use a tree diagram to display all possible outcomes visually. Additionally, when the outcomes of each stage are the result of a chance experiment, tree diagrams are helpful for computing probabilities.
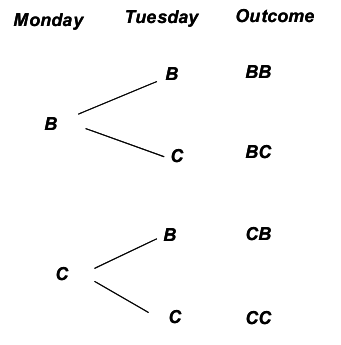
Example 1: Two nights of games
Imagine that a family decides to play a game each night. They all agree to use a tetrahedral die (i.e., a four-sided pyramidal die where each of four possible outcomes is equally likely—see image on page S.44) each night to randomly determine if they will play a board game (B) or a card game (C). The tree diagram mapping the possible overall outcomes over two consecutive nights will be developed below.
To make a tree diagram, first present all possibilities for the first stage. (In this case, Monday.)
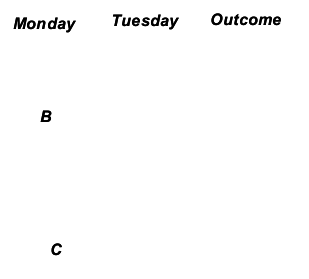 Then, from each branch of the first stage, attach all possibilities for the second stage (Tuesday).
Note: If the situation has more than two stages, this process would be repeated until all stages have been presented.
- If BB represents two straight nights of board games, what does CB represent?
- List the outcomes where exactly one board game is played over two days. How many outcomes were there?
Example 2: Two nights of games (with probabilities)
In the example above, each night’s outcome is the result of a chance experiment (rolling the tetrahedral die). Thus, there is a probability associated with each night’s outcome.
By multiplying the probabilities of the outcomes from each stage, we can obtain the probability for each “branch of the tree.” In this case, we can figure out the probability of each of our four outcomes: BB, BC, CB, and CC.
For this family, a card game will be played if the die lands showing a value of 1, and a board game will be played if the die lands showing a value of 2, 3, or 4. This makes the probability of a board game (B) on a given night 0.75.
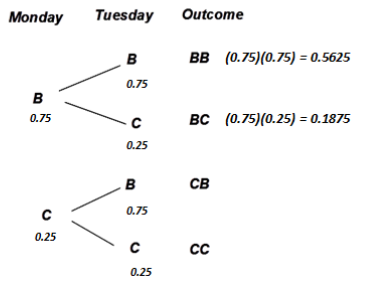
- The probabilities for two of the four outcomes are shown. Now, compute the probabilities for the two remaining outcomes.
- What is the probability that there will be exactly one night of board games over the two nights?
Exercises – Two Children
Two friends meet at a grocery store and remark that a neighboring family just welcomed their second child. It turns out that both children in this family are girls, and they are not twins. One of the friends is curious about what the chances are of having 2 girls in a family’s first 2 births. Suppose that for each birth the probability of a boy birth is 0.5 and the probability of a girl birth is also 0.5.
1. Draw a tree diagram demonstrating the four possible birth outcomes for a family with 2 children (no twins). Use the symbol B for the outcome of boy and G for the outcome of girl. Consider the first birth to be the first stage. (Refer to Example 1 if you need help getting started.)
2. Write in the probabilities of each stage’s outcome to the tree diagram you developed above, and determine the probabilities for each of the 4 possible birth outcomes for a family with 2 children (no twins).
3. What is the probability of a family having 2 girls in this situation? Is that greater than or less than the probability of having exactly 1 girl in 2 births?
Example 3: Mice
In a laboratory experiment, two mice will be placed in a simple maze with one decision point where a mouse can turn either left (L) or right (R). When the first mouse arrives at the decision point, the direction it chooses is recorded. Then, the process is repeated for the second mouse.
1. Draw a tree diagram where the first stage represents the decision made by the first mouse, and the second stage represents the decision made by the second mouse. Determine all four possible decision outcomes for the two mice.
2. If the probability of turning left is 0.5, and the probability of turning right is 0.5 for each mouse, what is the probability that only one of the two mice will turn left?
3. If the researchers add food in the simple maze such that the probability of each mouse turning left is now 0.7, what is the probability that only one of the two mice will turn left?
Assignment: 7.5.6.ProblemSet
[/expand]
Task: MARS Grade 7 – Counters