[expand title=”What is two variable (bivariate) data and how to we represent it visually?”]
Two variable, or bivariate data are two pieces of information that are related (or sometimes not related!). With single variable data, we are just measuring one aspect, such as the height of a spaghetti tower, and relating it to its self. With two variable data, we are relating one type of data to another and looking for a potential association or causation.
An association would tell us the two measurements or pieces of information are related in some manner, such as time of day and average temperature.
Causation is when we can justify that changing one variable would produce a measurable change in the other variable. For example, increasing freeway speeds increases fatal car accidents.
Exercise
Student height and shoe size
Measure every student’s height and shoe size. Have them plot their measurements on a scatter plot.
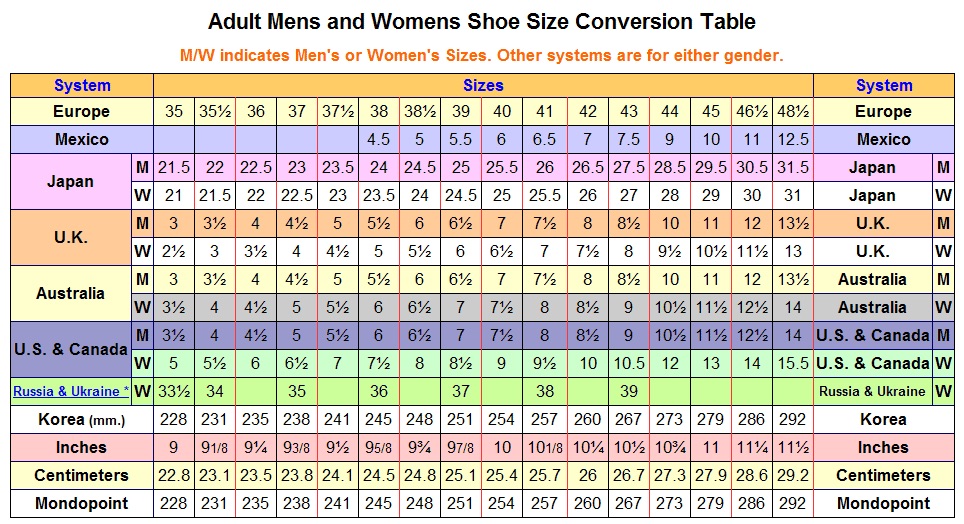
Create a scatter plot of the data points.
Assignment: Create a set of two variable data for 25 individuals. On a separate page, construct a scatter plot (remember labels, scales, and a title).
[/expand]
[expand title=”Focus on strength and direction”]
How do we describe two variable data?
- We look at the strength in relation.
- Graphs that closely resemble a line is strong
- Graphs that are not very linear is weak
- Graphs that are somewhat linear are moderate
Lets look at some student examples…. How would we describe their strength?
Correlation
Another method to assess the strength of a data set is to calculate the correlation:
(Use a calculator or computer!!!!!!!!!!!!)


The correlation is only appropriate for linear data (data that is shaped like a line).
A value of |r| = 1 means the data is exactly on a line, and |r| = 0 means there is no pattern t the data.
The sign of r tells us the direction – a positive value indicates larger values of x are paired with larger values of y, or a positive slope. A negative value of r would tell us it has a negative slope.
Correlation coefficient estimation
Assignment: Calculate the correlation coefficient of your data and discuss its strength and direction.
[/expand]
[expand title=”Focus on form, and outliers”]
Warm Up
Create a scatter plot of the following data sets:
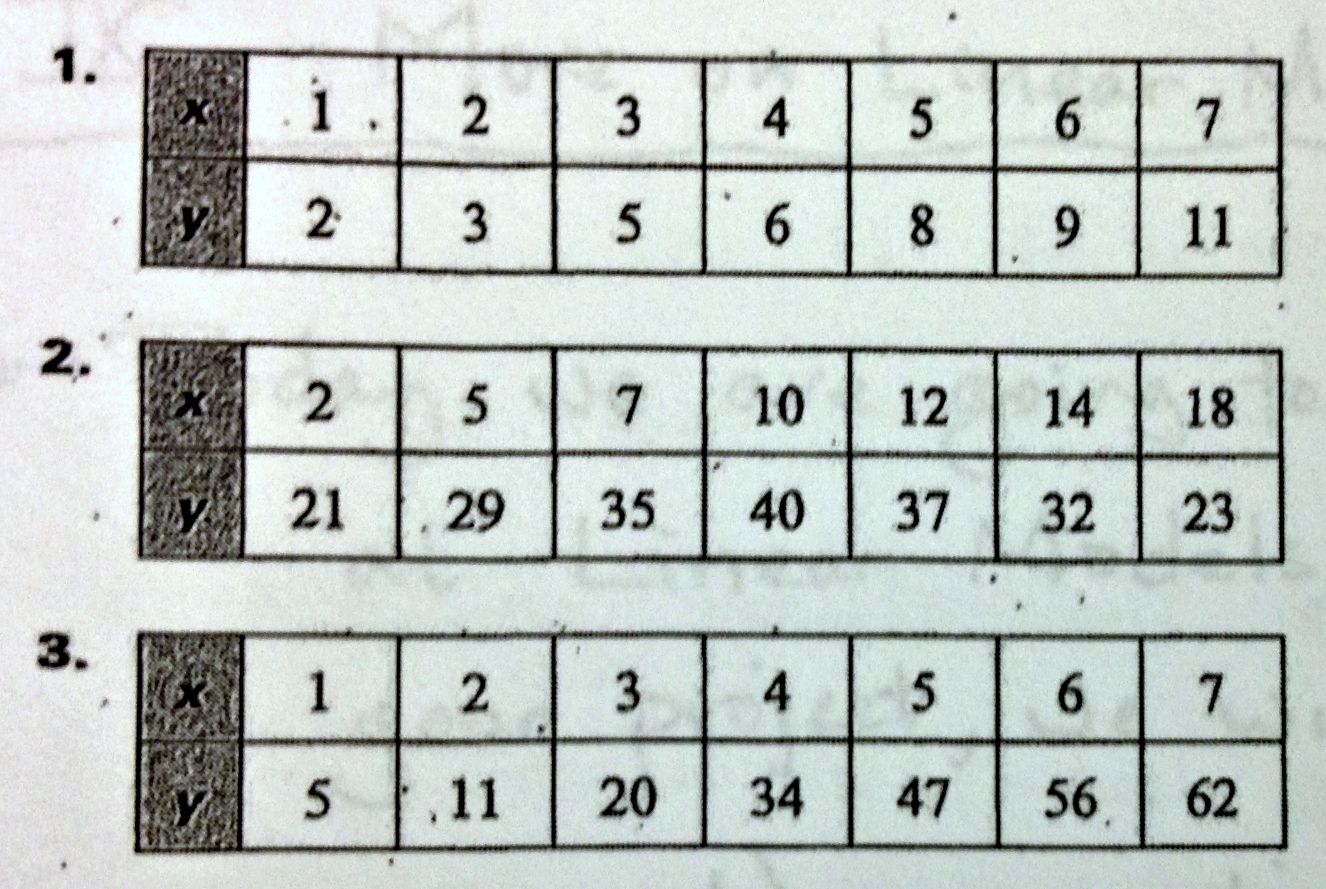
Form
Form is the discussion of pattern/shape of two-variable data. When we describe the form, we are usually looking ahead to the mathematical model that we want to build to represent out data.
There are many possibilities, but we focus on three common and useful models: linear, exponential, and quadratic (these are the functions we will study this year).
When describing form, be descriptive. Start by deciding if the data appear to be linear or not. If not, decide if the data may be exponential or quadratic. After that, describe what you see.
Lets look at those warm up scatter plots…
Outliers
There is no mathematical definition for outliers with two-variable data, so we use our descriptive definition: an outlier is any value that does not seem to fit the pattern of the data set.
Are there any outliers in the warm up plots?
Assignment: Create a scatter plot for the following data set:
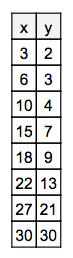
Discuss the form of the data/plot.
Discuss and outliers.
[/expand]
[expand title=”Two variable review”]
[/expand]