Essential Question: What is a Graphing Story?
[expand title=”Warm up”]

Describe the motion of the man in words.
[/expand]
[expand title=”Lesson”]
![]() S.1 Example 1
S.1 Example 1
- How high do you think he was at the top of the stairs? How did you estimate that elevation?
- Were there intervals of time when his elevation wasn’t changing? Was he still moving?
- Did his elevation ever increase? When?
- How should we label the vertical axis? What unit of measurement should we choose?
- How should we label the horizontal axis? What unit of measurement should we choose?
- Should we measure the man’s elevation to his feet or to his head on the graph?
- The man starts at the top of the stairs. Where would that be located on the graph?
- Show me with your hand what the general shape of the graph should look like.
![]()
S.1 Example 1
Work with your partner to draw the graph of the story
![]()
S.2 Example 2 (Partner Work)
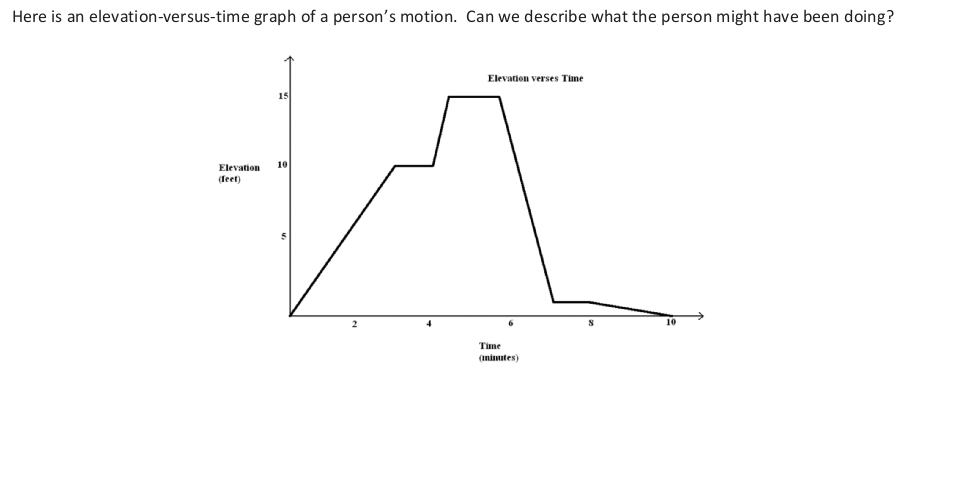
- What is happening in the story when the graph is increasing, decreasing, constant over time?
- What does it mean for one part of the graph to be steeper than another?
- How does slope of each line segment relate to the context of the person’s elevation?
- Is it possible for someone walking on a hill to produce this elevation versus time graph AND return to her starting point at the 10-minute mark? If it is, describe what the hill might look like.
- What was the average rate of change of the person’s elevation between time 0 minutes and time 4 minutes?
[/expand]
[expand title=”Summary”]
[/expand]
[expand title=”Problems”]
![]()
S.3-4
[/expand]
[expand title=”Exit”]
[/expand]